

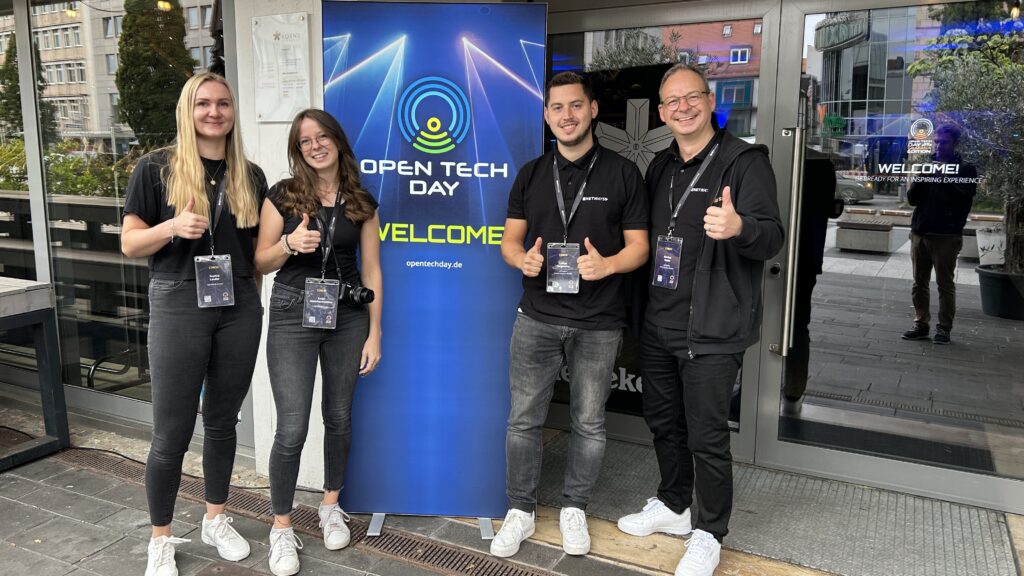
Hello, I’m Leander and I work as a consultant at NETWAYS Professional Services. I’m excited to share my impressions of the Open Tech Day 2025 – Grafana Edition. Having started working with the Grafana Stack earlier this year, I found this event to be the perfect opportunity to explore advanced use cases in more depth and learn how others in the community are applying Grafana in practice.
The Morning
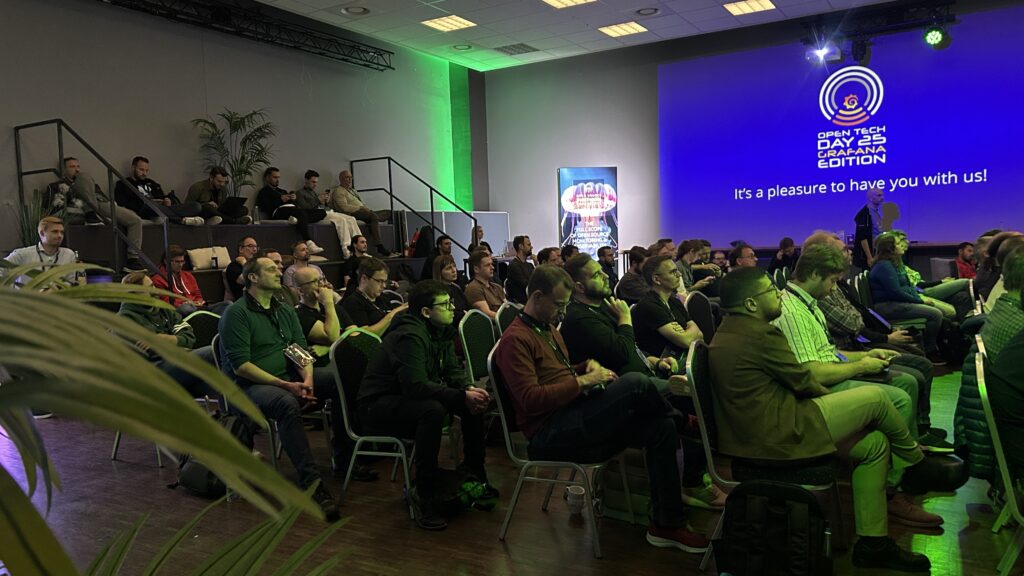
The day began with breakfast and drinks, followed by a short welcome from the organiser NETWAYS and the main sponsor, Grafana Labs.
The early talks, „Intro to Observability“ by Sebastian Schubert and „Learning Grafana Skills for Effective Monitoring“ by Syed Usman Ahmad, both from Grafana Labs, set the stage for the day. They focused on building a shared understanding of observability, covering what the term means, why it matters and how it differs from traditional monitoring. The speakers introduced the core terminology and concepts before walking us through the main Grafana Stack tools, such as Grafana, Mimir, Loki, Tempo and Alloy. For me, these sessions provided a useful introduction to the field and demonstrated what Grafana Labs has to offer.
The final talk of the morning program I would like to highlight was „Grafana Dashboards as Prompts“ by Denys Kondratenko. This talk explored how AI can help us bootstrap, generate and maintain Grafana dashboards. One key example was using AI to review changes in large dashboard definition files, which often span thousands of lines and are difficult to compare manually. Another example demonstrated how MCP servers, such as the one provided by Grafana, can connect directly to an instance and enable you to query dashboards. For instance, you could ask for an explanation of a particular dashboard. Finally, the speaker demonstrated how AI could help generate new dashboards as a starting point. However, the current limitations of the models mean that significant manual refinement is still required.

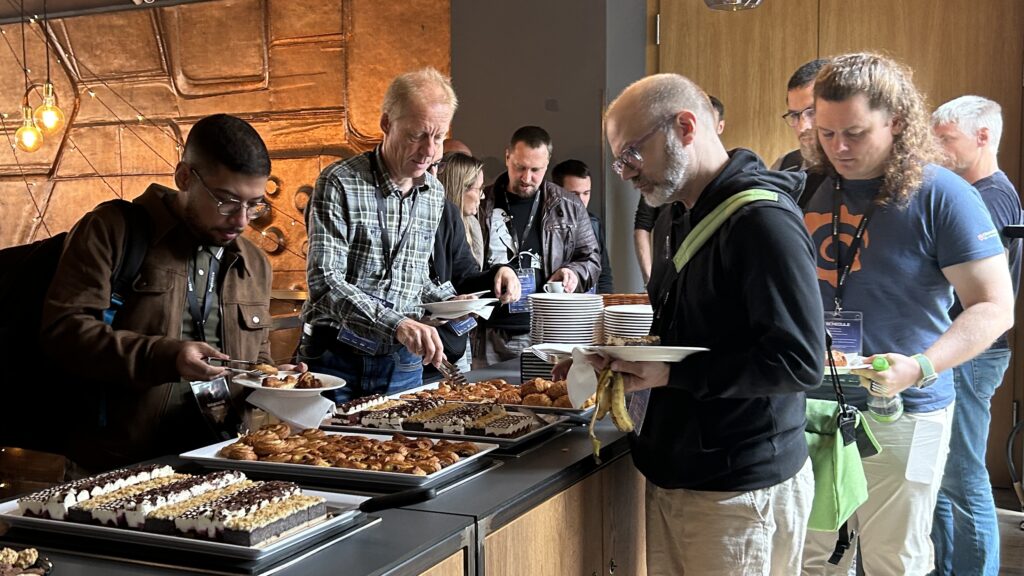
The Afternoon
After lunch, the afternoon program began with Ignite Talks. As always, ignites are short and entertaining, providing new ideas to think about.
There were a lot of great talks in the afternoon, but two stood out for me because I didn’t have any prior knowledge of those fields.
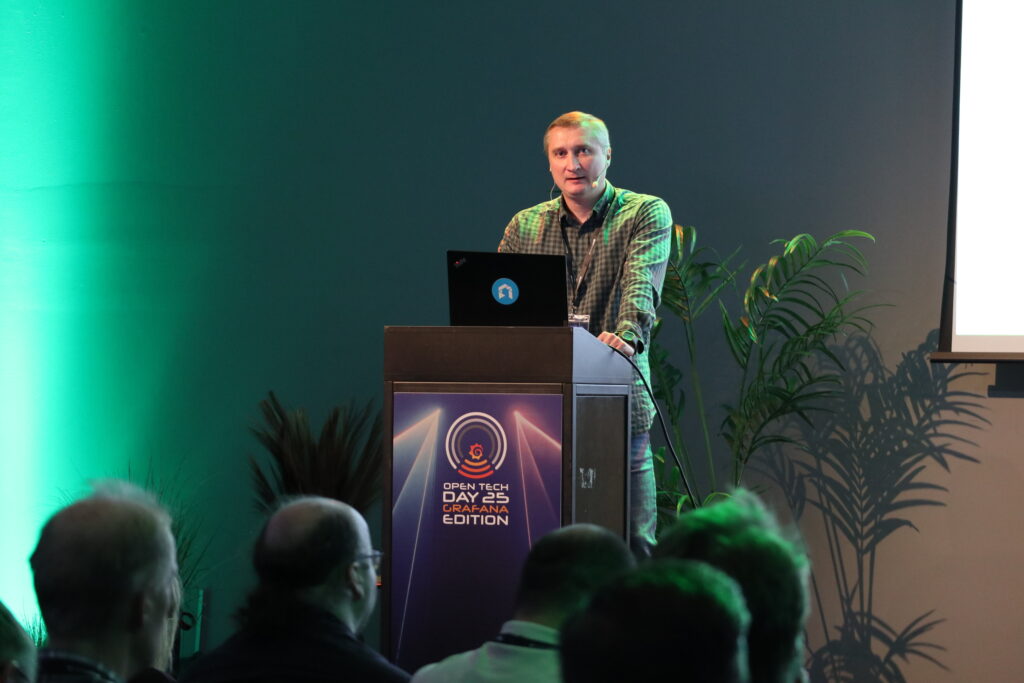
The first talk I was curious to listen to was „Zero Code Instrumentation with eBP„ by Fabian Stäber, who is also one of the maintainers of the Beyla project. Beyla is a zero-code instrumentation tool by Grafana that allows you to get signals from your application automatically. Beyla was recently donated to the OpenTelemetry project, which I think shows that Grafana is really trying to give back to and help grow the open source community. The talk gave me a good overview of how to work with Beyla and the use cases for it.
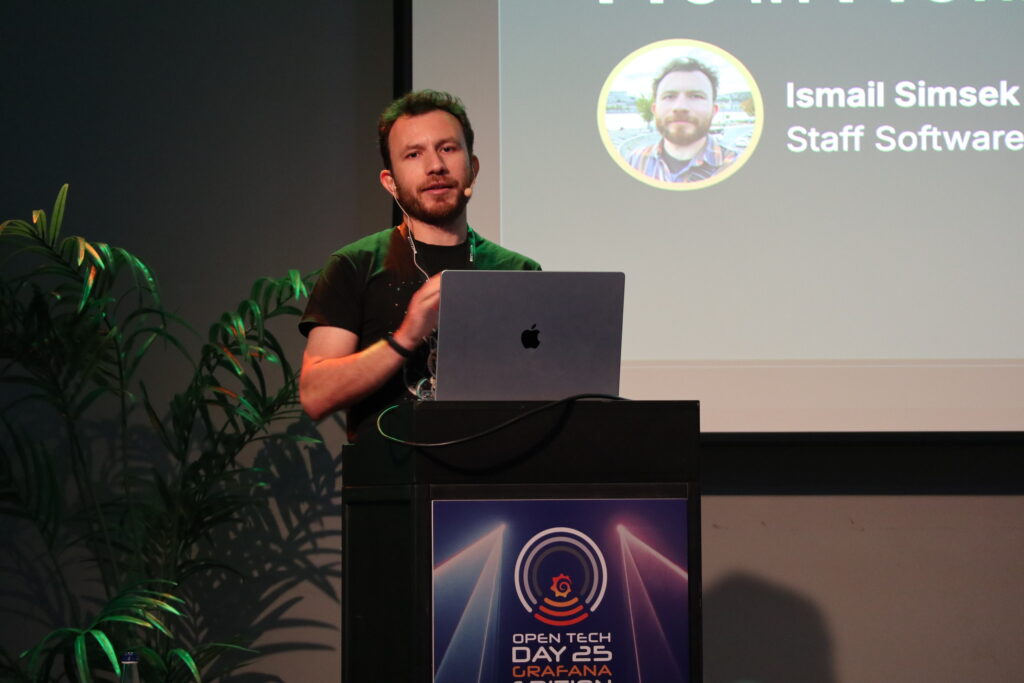
The second talk I was interested in was „Putting the Pro in Profiles“ by Ismail Simsek. In his talk, he introduced Continuous Profiling and explained how it is used to gain deeper insight into what your system is doing. The two main advantages of observing profiles are reduced costs and increased performance. Profiles are statistical summaries of events over time that help you identify problems in your software. Using them allows you to see exactly which part of your software is using up your system’s resources. Ismail then showed us some examples, and he also explained how to navigate profiles and identify problems. For me, this provided valuable insight into a completely new topic.
Conclusion
As always, our NETWAYS event team organised a fantastic event. I think the main sponsor, Grafana Labs, did a great job of providing valuable insights into Grafana, and there was plenty of useful information. For me personally, the main takeaways are: It was interesting to see someone effectively use AI to enhance their work with Grafana, and to learn new ways of observing with zero instrumentation and continuous profiling.


0 Kommentare