

Are you paying for metrics you never actually use? And how many of your alerting rules are silently broken? These questions caught my attention when I saw Roman Khavronenko’s talk in the OSMC 2025 program. As someone who’s been working with monitoring systems, I was eager to learn how to make monitoring more efficient and cost-effective.
Introducing the Speaker and the Topic
At OSMC 2025, Roman Khavronenko from VictoriaMetrics presented his talk focused on a critical but often overlooked topic: identifying unused metrics and broken alert rules in monitoring systems. Using VictoriaMetrics‘ built-in tools, he showed practical ways to clean up monitoring infrastructure and reduce both costs and cognitive load.
Why Observability Is Expensive
Roman opened with a sharp observation: modern observability stacks cost far more than they should. Many of today’s systems were inspired by Big Tech architectures built during a period of cheap capital, where infinite scalability mattered more than efficiency. As a result, we’ve ended up with monitoring ecosystems assembled from modular components that emit large numbers of metrics “just in case” — and companies often pay to store data they never query.
The underlying issue is simple: complexity breeds more complexity. Even attempts to “simplify” observability by adding AI layers often just add another abstraction on top of an already overloaded system.
“Ghost” Metrics: The Hidden Cost
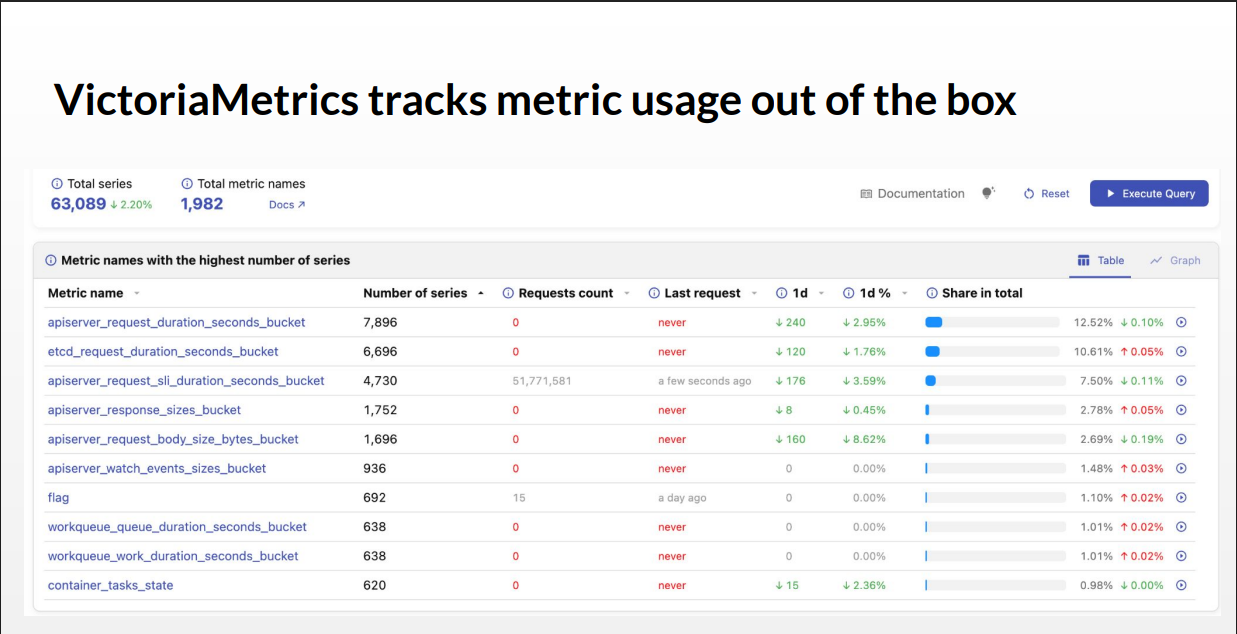
Roman introduced a concept that really clicked for me: If you’re not querying a metric, why are you paying to store it? Metrics serve three purposes: alerting rules, dashboards, and ad-hoc investigations. If a metric isn’t being used for any of these, you’re paying rent for storage you don’t need.
VictoriaMetrics‘ Cardinality Explorer
Roman demonstrated VictoriaMetrics‘ built-in „Cardinality Explorer,“ which automatically tracks metric usage . The tool shows which metrics are never queried, occasionally queried, or repeatedly queried—helping to identify what can be safely removed.
Silent Alerts: The Broken Safety Net
The second major problem is broken alerting rules. Here’s the challenge: the normal state for an alert is inactive, returning no results. But a broken alert also returns no results. How do you tell them apart? Roman showed a real example: an alert for KubeControlManagerIsDown that would never fire because of a typo:
alert: KubeControlManagerIsDown
expr: up{job="kube-controler-manager"} == 0
The job name was missing an „L„—it should be kube-controller-manager. This alert just sits there, quietly broken, while you think everything’s fine.
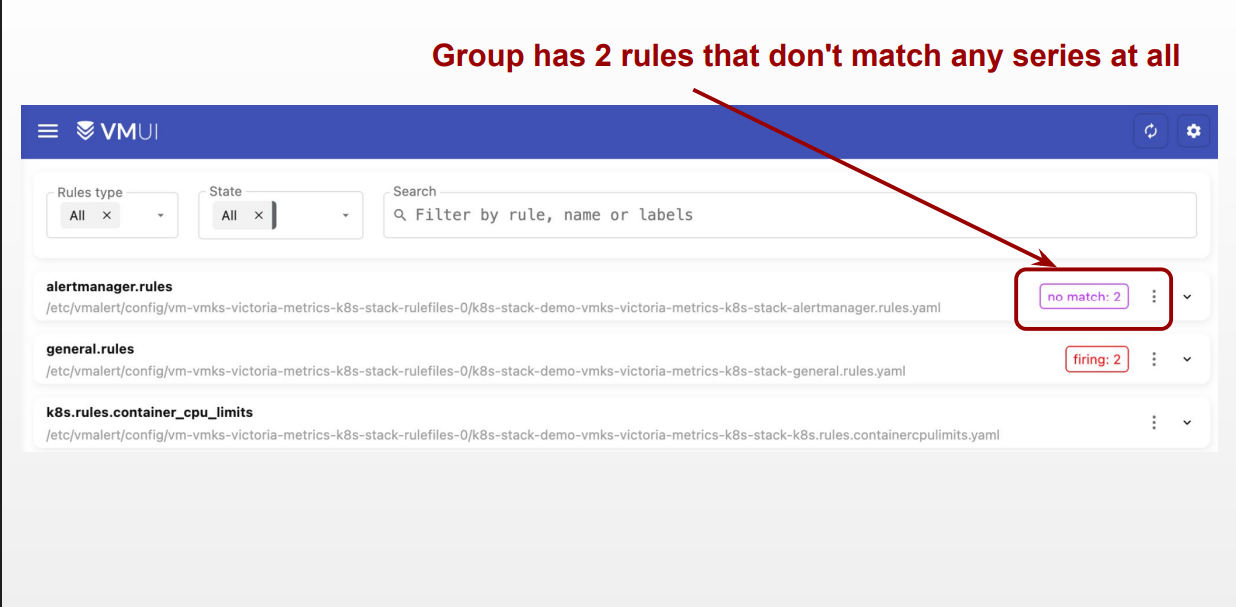
VictoriaMetrics‘ Alerting Page
VictoriaMetrics lists all alert rules and flags any rule that isn’t matching data series. A separate “meta-alert” can be created to notify when a rule is broken:
A Detective Story: The Deprecated Metric
One memorable moment was Roman’s investigation of a rule matching no series for scheduler_e2e_scheduling_duration_seconds_bucket. Digging deeper, Roman found something wild. He discovered:
- The metric was deprecated 2 years ago in Kubernetes
- The rule came from prometheus-operator
- Which imported it from kubernetes-mixin
- Which was last updated 6 years ago
This chain of outdated dependencies raises a critical question: Do you still trust your monitoring?
Personal Takeaways
What struck me most was the shift in perspective. We’re constantly adding more monitoring, but rarely ask: „What can we remove?“ The idea that metrics need to „pay their rent“ really resonated with me. It’s not about what we might need someday—it’s about what actively provides value today.
As someone relatively new to monitoring, I also appreciate how honestly Roman discussed these challenges. Even experienced teams struggle with unused metrics and broken alerts, and it’s reassuring to know there are practical tools to address them.
The Bigger Picture: Less Is More
Roman’s approach offers real benefits: reduced storage costs, better query performance, less cognitive load during incidents, and increased confidence in your monitoring. VictoriaMetrics makes this process actionable through built-in observability features.
Sometimes, the cheapest metric is the one you never write.
Save the Date
If this talk sparked your curiosity about building leaner, more trustworthy monitoring, make sure to join OSMC 2026 from November 17–19 in Nuremberg to experience more insights into open source monitoring solutions live with the community.


0 Kommentare