While Alvar who wrote the recap of yesterday was at the OSMC for the first time, you know me probably from one off the earlier editions and so do many attendees. This is the reason I really enjoyed most seeing familiar faces and having a chat with people. And this does not mean I did not enjoy giving a workshop on Tuesday or the talks yesterday as everything at OSMC is high quality in my opinion and I can compare it with many different conferences I attended over the years.
The Morning
Easy logging refinement with FlowG
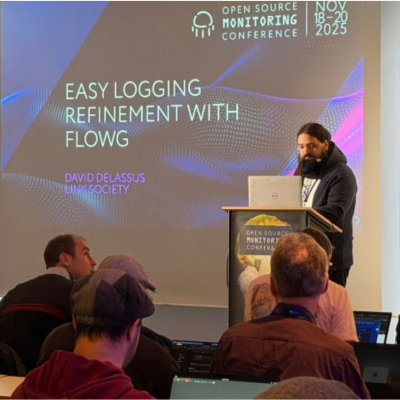
As always some attendees stayed up nearly to the time the first woke up for the breakfast but nevertheless the room for the first talk was full of interested people. I joined David Delassus with his talk „Easy logging refinement with FlowG“. David is a passionate open source developer and with his experience he could easily get everyone in the room introduced to logging and the pitfalls we typically face with different formats.
With this in mind he asked what we expect from a logging solution. We want it to ingest different sources and formats, to parse it to structured data, to classify the data based on different needs and then to refine them. Of course the data has to be stored afterwards and perhaps forwarded to another solution. And last but not least we want to search the logs.
FlowG is a tool that gives you all of this while trying to simplify all the step. The complete processing pipeline can be configured via a graphical UI which opens up the topic for users scared of the often very long text based configuration of other solutions. Also the visualization of the logs looks quite nice, and the deployment seams simple so you can easily give it a try. Only feature I personally do not like is that its central storage is Splunk which for me is a synonym for expensive software. But FlowG is still under heavy development, so you can get involved and influence its future in the way it fits your environment.
Scale Your Monitoring Solution With the VictoriaMetrics Ecosystem
Second talk of today was „Scale Your Monitoring Solution With the VictoriaMetrics Ecosystem“ by Jose Gómez-Sellés. Jose started with what he called the good all days where he was responsible for a simple application creating easy to parse logs when debugging problems. But now in a world of microservices everything is more complicated even the logs.
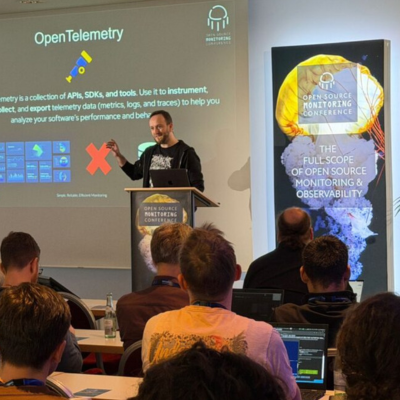
For him the horror started when multiple different applications and teams needed to work together but everyone pointed to the other when a problem occurred and nobody had the logs to argue and prove things. The solution was adding Prometheus everywhere which of course added new problems as handling the amount of metrics in production came with its own challenges. Those challenges where solved for him with the migration from Prometheus to VictoriaMetrics.
To prove his point he had a big amount of benchmarks, but what I liked he did not claim that this will be the same for everyone and encouraged to benchmark yourself instead. The replacement is easy as VictoriaMetrics is designed as a drop-in replacement. By sticking with Opentelemetry compatibility it also benefits from this ecosystem and with Grafana you can have a front-end many are familiar with. Jose did not stop here he showed even more advantages of VictoriaMetrics like the scaling and gave helpful advice what additionally to consider when scaling.
From logs and metrics Jose came to traces as he argued that traces are the only thing giving you the complete context and show the full picture. With VictoriaTraces there is now also a tool for this from the VictoriaMetrics ecosystem which he also demoed.
Cognitive and Self-Adaptive System for Effective Distributed-Tracing (using Jaeger, Open Tracing)
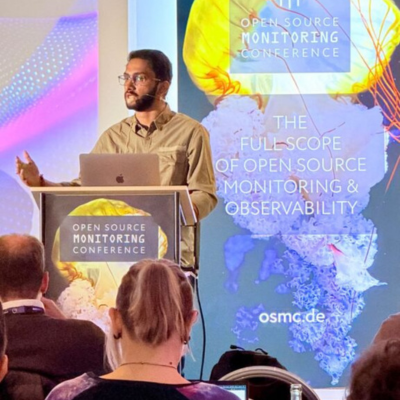
As the last talk of the morning session I joined Susobhit Panigrahi talking about „Cognitive and Self-Adaptive System for Effective Distributed-Tracing (using Jaeger, Open Tracing)“. He started with his answer on the question why you should use distributed tracing by showing a nice graph where the trace was the only way to follow the user request through a complex application environment.
From this he dived deeper, for example he spoke about the advantages and disadvantages of head and tail based sampling. Another topic covered where the sampling rate which effects storage and coverage and you need to find the balance based on your needs as for example a low rate means also a quite low storage requirement but you could miss the important traces. So with an adaptive sampler engine the system itself will try to find the best rate itself.
The Afternoon
Ignites
After lunch it was like always time for the ignites. I like the format of 5 minutes with automated slide deck as it gives some room for other topics. For the first ignite „Discovering the Magic Behind OpenTelemetry Instrumentation“ Jose Gómez-Sellés returned to the stage. He focused not on the zero-code, automatic instrumentation but on how to instrumented a C++ application to get traces in OpenTelemetry format. A nice and brief introduction to the topic which could fill also the slot of a full talk.
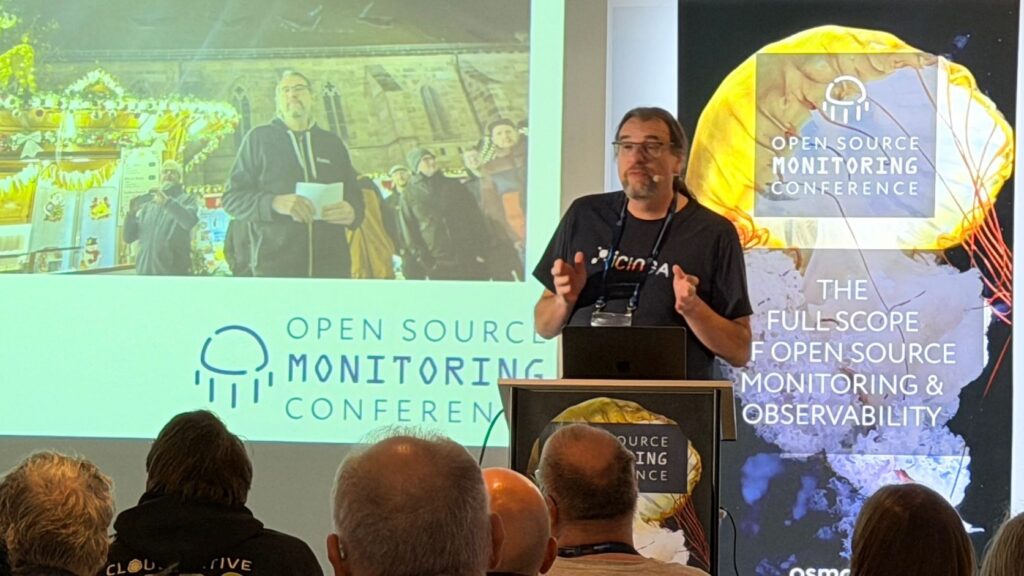
Second one was my ex-colleague Lennart Betz who talked about the „Tour through Nuremberg“ he had given on Tuesday, giving the attendees some historic facts about Nuremberg. I think even those attending the conference for many years learned something new.
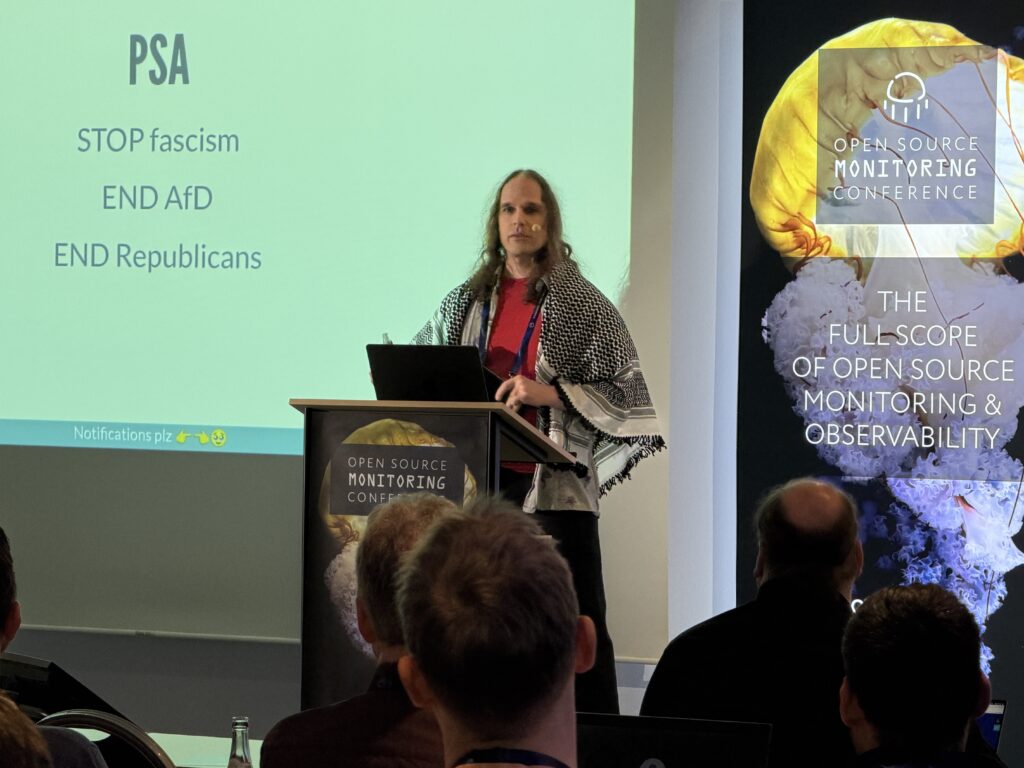
Felix Frank again gave a talk touching topics others would avoid, so under the title „All I want is some notifications 😭“ he addressed also with at least one slide fighting racism before he came back to notifications. On topic he presented pushover.net as an alternative to email.
Generative AI for Observability: Automating Root Cause Analysis in Modern IT Systems
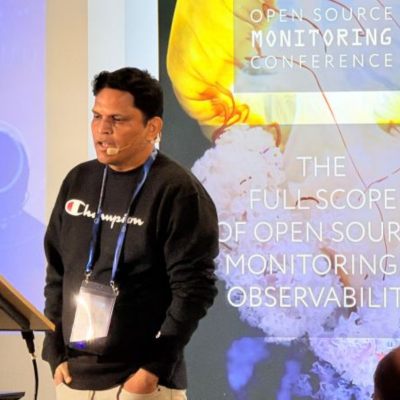
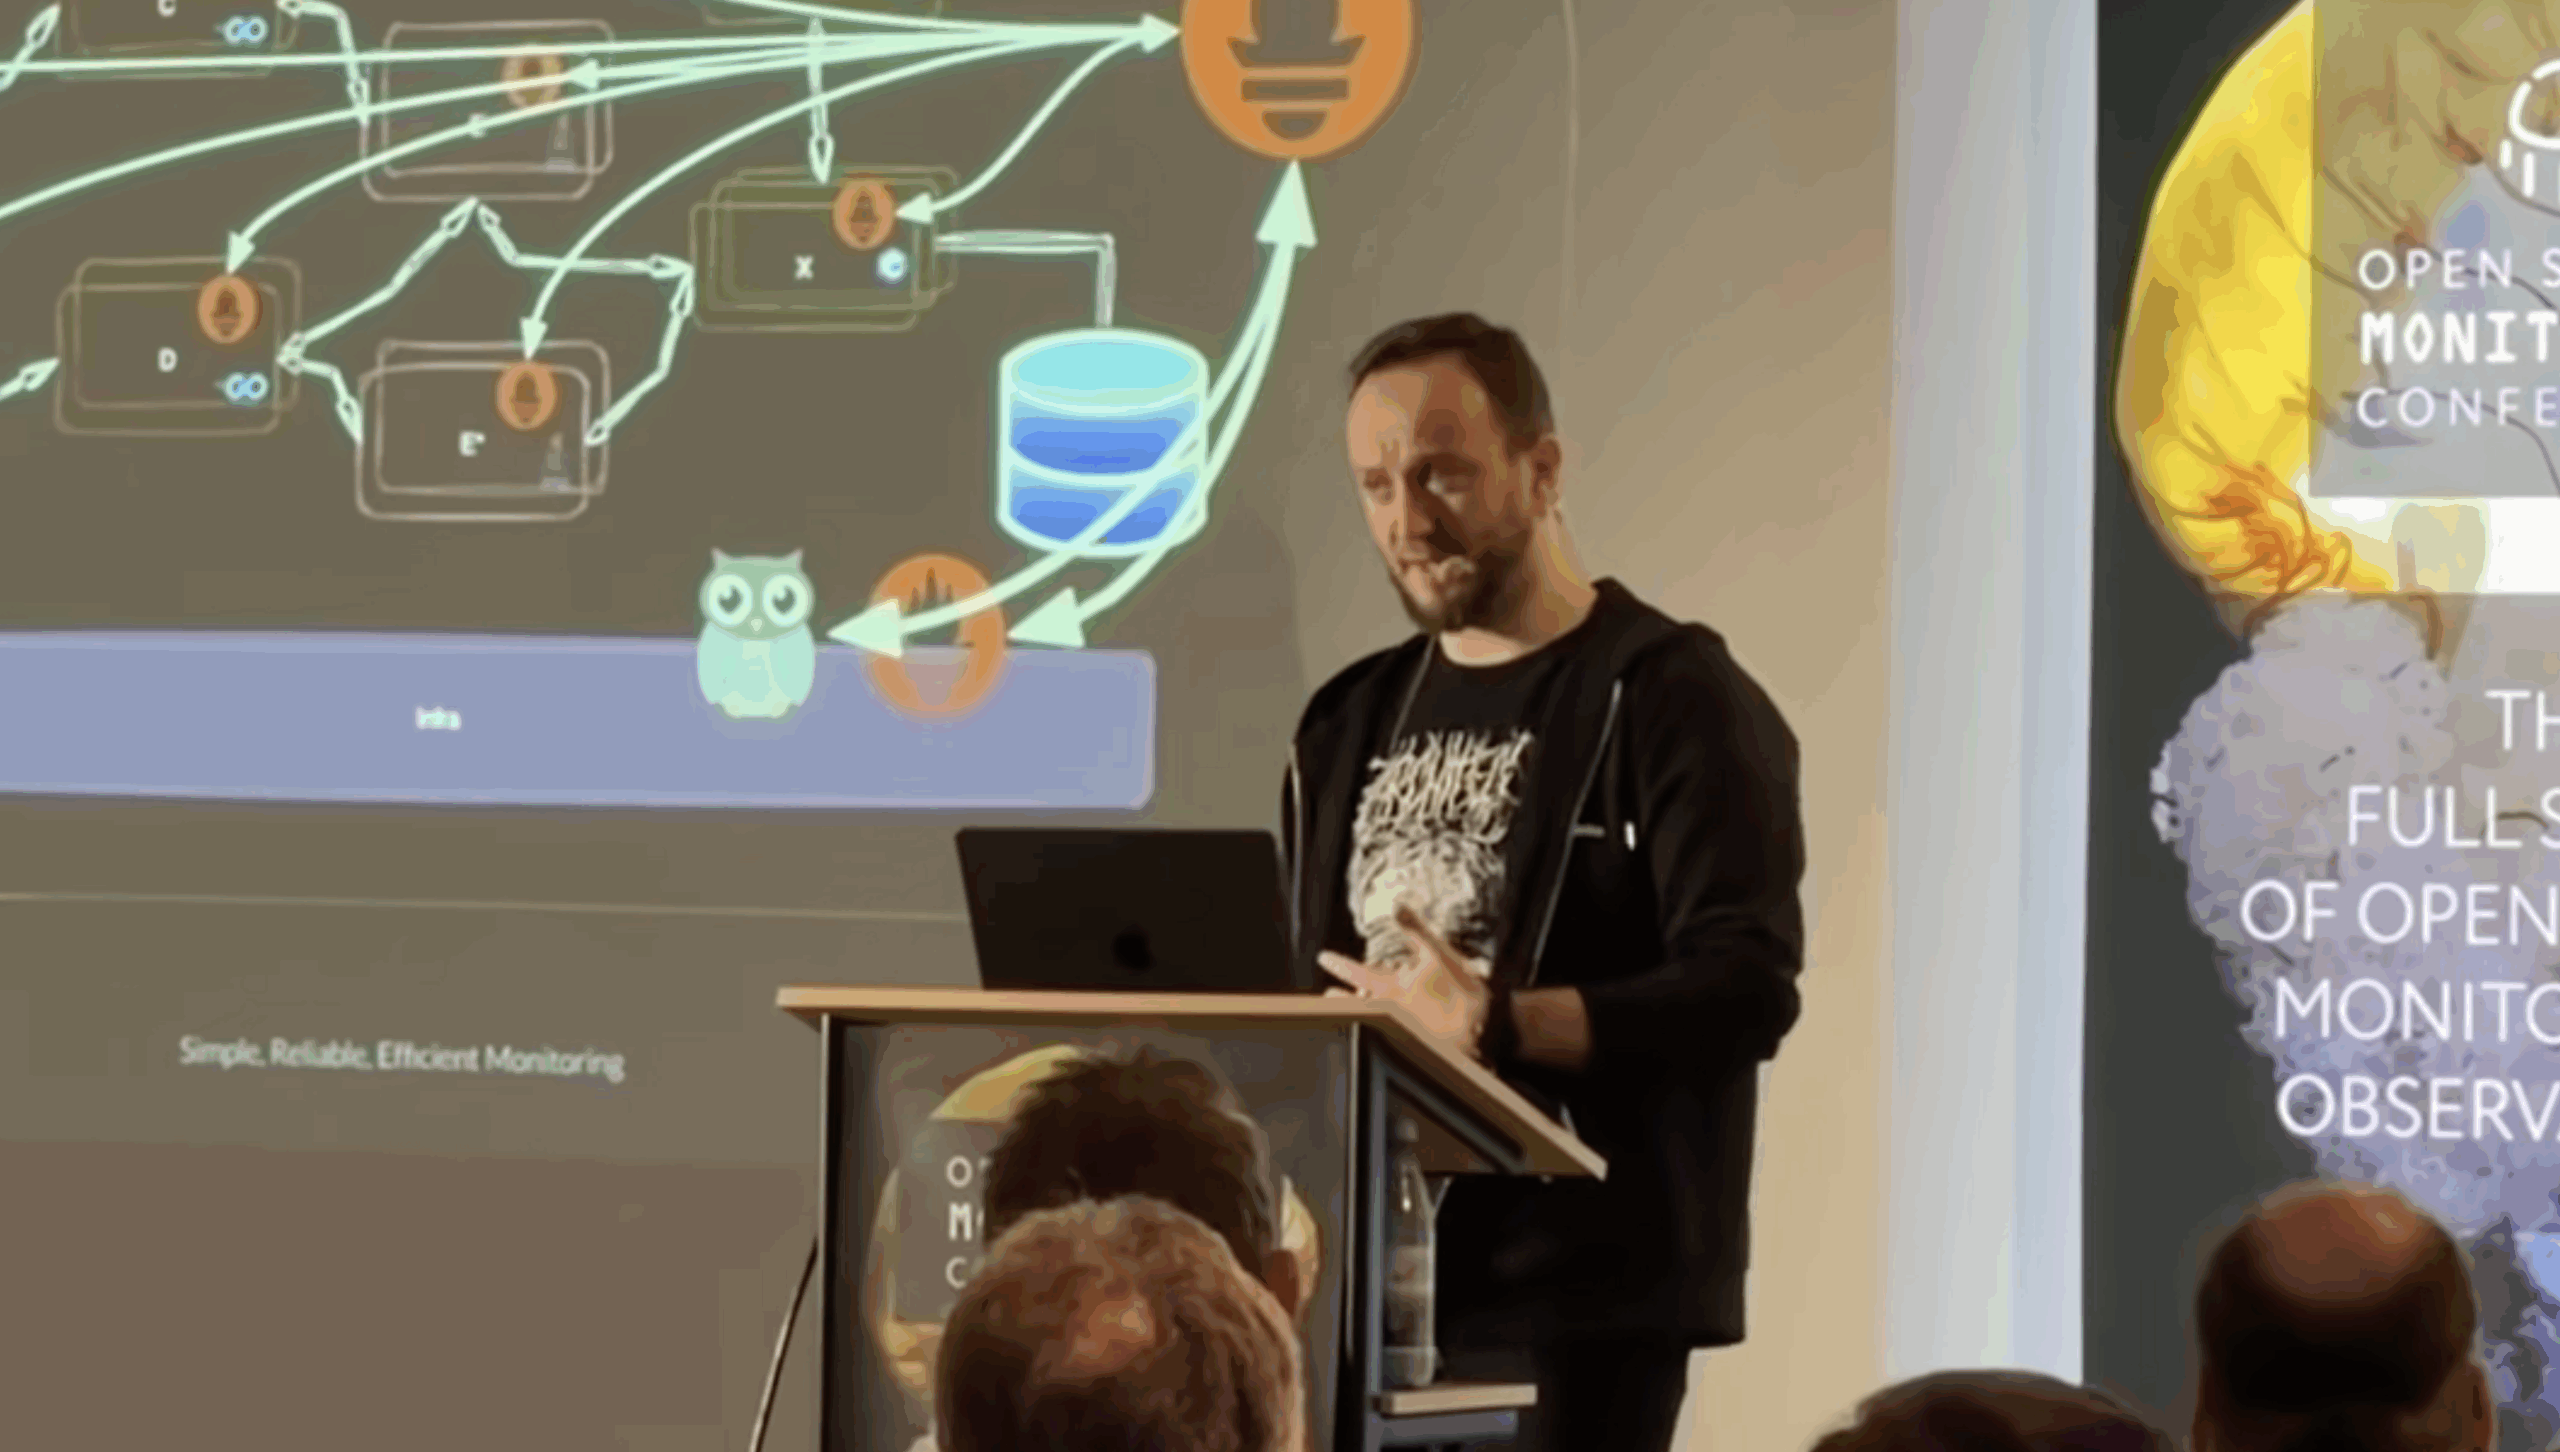
I know, I know, another AI talk, but I was interested in Kamal Bisht’s talk „Generative AI for Observability: Automating Root Cause Analysis in Modern IT Systems“ as Root Cause Analysis is like the holy grail of monitoring and something I believe AI could be really useful for. After a basic introduction he pointed out the current challenges with a traditional approach and tooling and where AI could solve them. For example currently the analysis happens after an outage to find the cause while AI could predict it more easily.
But he then dived even deeper talking about possible architecture including how to add the required context to the AI. Kamal touched so many topics, giving great details and advice, making it hard to summarize his talk. So while he did not give a complete solution even admitting he is at a prototype stage with his own setup I would recommend you watch the recording if you are interested in the topic.
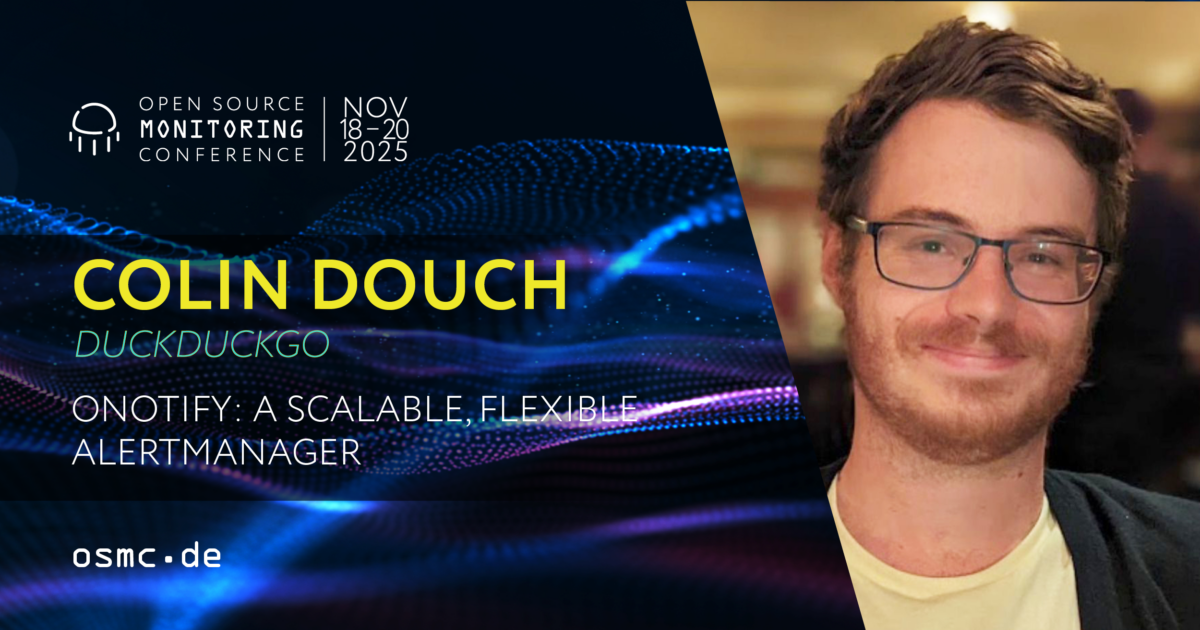
onotify: A scalable, flexible Alertmanager
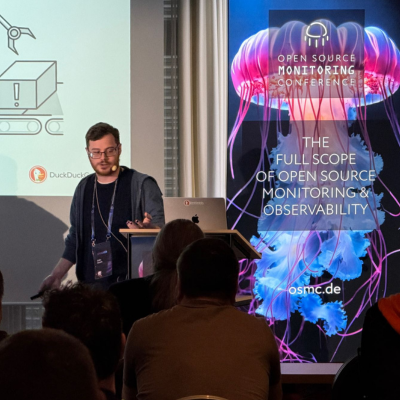
Colin Douch talked about „onotify: A scalable, flexible Alertmanager“. He started with a nice joke about monitoring tools he needs to replace which are so old he even does not know them which hit me hard as I know them pretty well! He then looked in some newer tools and what they are missing compared to the older ones and what this means in the end. His first example was the Alertmanager missing authentication and so being unable to automaticly provide the creator of an alert. And he showed other examples like this including his main complained about Alertmanager not having some feature because they are offloaded to a vendor what he called a toxic take on open source.
As an alternative he introduced onotify solving these issues. It also provides a nice and simple way to migrate by uploading the Altertmanager configuration to it. To proof this he gave a nice live demo including acknowledging the notification via phone call live and I have to admit it looked nice. So onotify is also still under development and wants to learn from other solutions, keep an eye on it!
Icinga2 Satellite as a Container

Last but not least „Icinga2 Satellite as a Container“ by Gabor Bukovszki who has to monitor over 100 locations with over 4000 servers where not everywhere a Linux administrator is onsite making Linux an issue. So on the wish list was having a low entry barrier which he tackled with containers and virtual appliances. He nicely explained the stack they use and while I perhaps disagree with some decisions the most important thing is of course it solves the requirements.
Another talk that is hard to summarize because of the amount of details, but it was interesting to see how they tackled the problems they faced. So another recommendation for your watch list if you are facing similar issues. Very likely you will not copy their solution as it is quite specific to their environment but you can get some ideas and inspiration.
Conclusion
It was another great conference and I want to thank everyone for making it such a great event be it Speaker, Sponsor, Attendee or all the colleagues involved. Without all these people it would not be such a great experience! For all those traveling home now: Save travel and see you next year!
If you also want to join us next year for the 20th installment of the Open Source Monitoring Conference, the date is already fixed. So get a ticket when they become available and be in Nuremberg November 17th to 19th next year.




0 Kommentare