

Beginning with the evening event on Day 2. It was fantastic, featuring great food, engaging conversations, and networking opportunities. There were arcade machines and excellent service, making it a memorable experience for all attendees.
The Morning
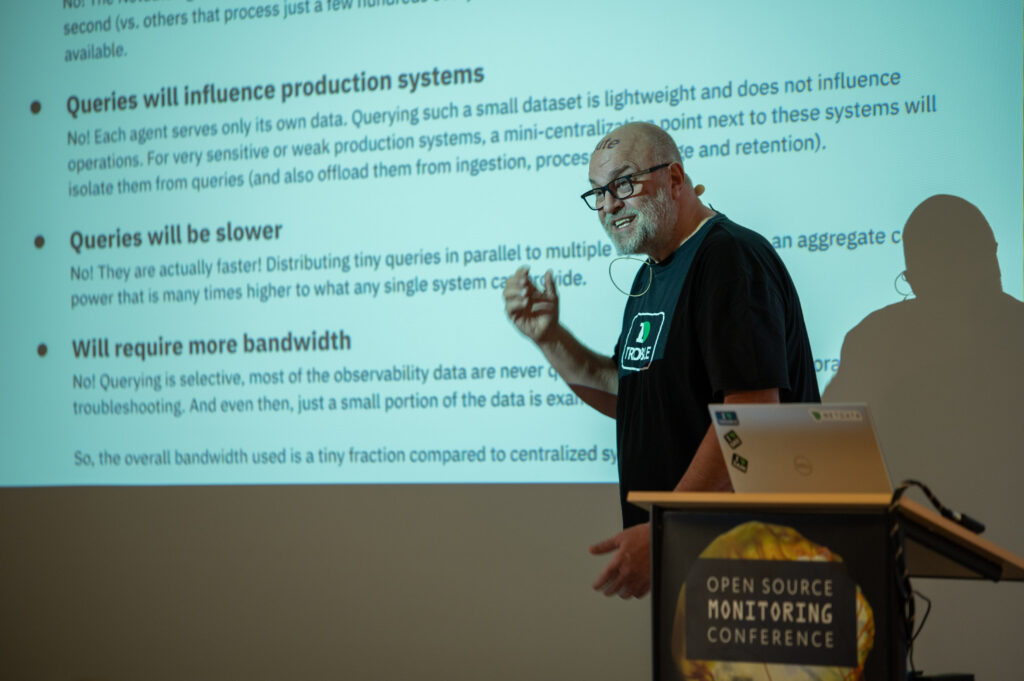
The first talk I attended was about Netdata: Open Source, Distributed Observability Pipeline – Journey and Challenge. I learned that Netdata is a powerful open-source tool designed to address key problems of centralization by distributing the monitoring workload, solving scalability issues, and reducing the cost of ownership by putting the code directly on the machines.
The speaker, Costa Tsaousis, who is the Founder and CEO of Netdata, shared an in-depth overview of their journey in building Netdata, highlighting the challenges they faced and the innovative solutions they developed.
What stood out to me was Costa’s very engaging and powerful presentation style, especially considering the early hour of the day. His passion for innovation and open-source was truly inspiring.
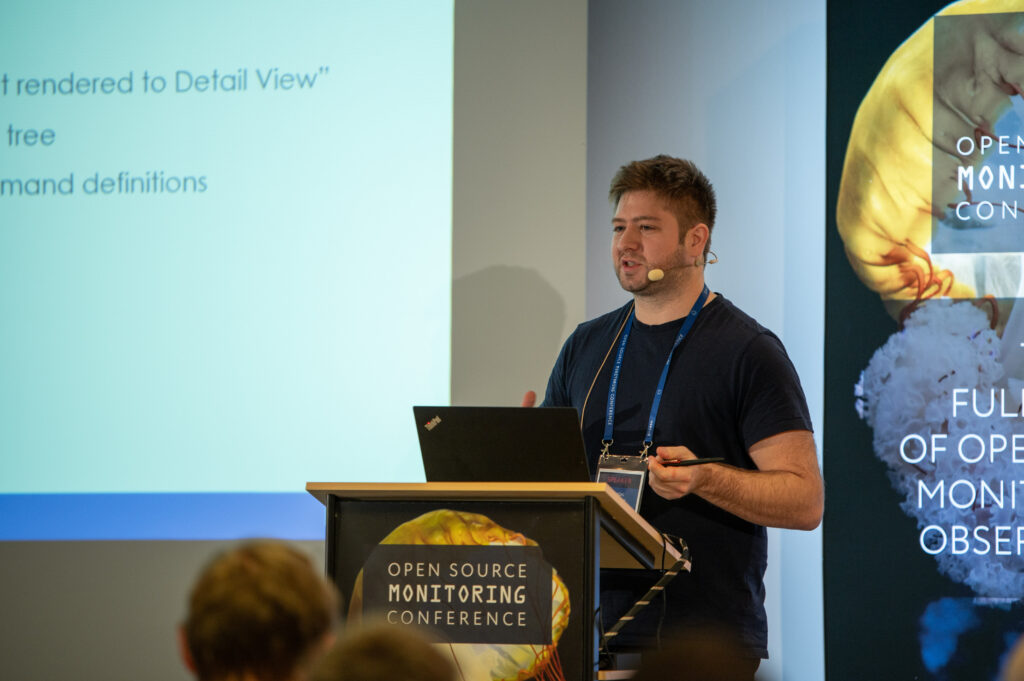
The second talk was also very interesting and focused on extending the functionality of IcingaWeb2. The speaker discussed various modules, including one for OpenID Connect integration and another for user registration via email. This module allows new users to set their own passwords through a token URL.
Additionally, a Selenium test suite interpreter was introduced, which enables the creation and execution of Selenium test suites within IcingaWeb2. The speaker, Nicolas Schneider from RISE GmbH, shared his expertise and passion for enhancing Icinga Web, making the presentation both informative and engaging.
The last talk of the morning, before lunch, was about Palindrome.js: 3D Monitoring for Distributed Systems. Unlike traditional 2D graphs, Palindrome.js allows system administrators to visualize system metrics and KPIs in a 3D environment, modelling digital twins.
This approach facilitates a quick understanding of relationships between different architecture levels and multiple dimensions of information. Additionally, Palindrome.js supports Grafana through a specific plugin, which has limited support for the DSL describing the Palindrome.js structure.
Jonathan Rivalan conveyed his deep expertise and enthusiasm for open-source solutions, making the presentation both insightful and compelling.
The Afternoon
After an extensive lunch break, the event continued with Ignite Talks. The Ignite presentation format consists of 5-minute presentations with 20 slides that automatically advance every 15 seconds, requiring speakers to get to the point quickly.
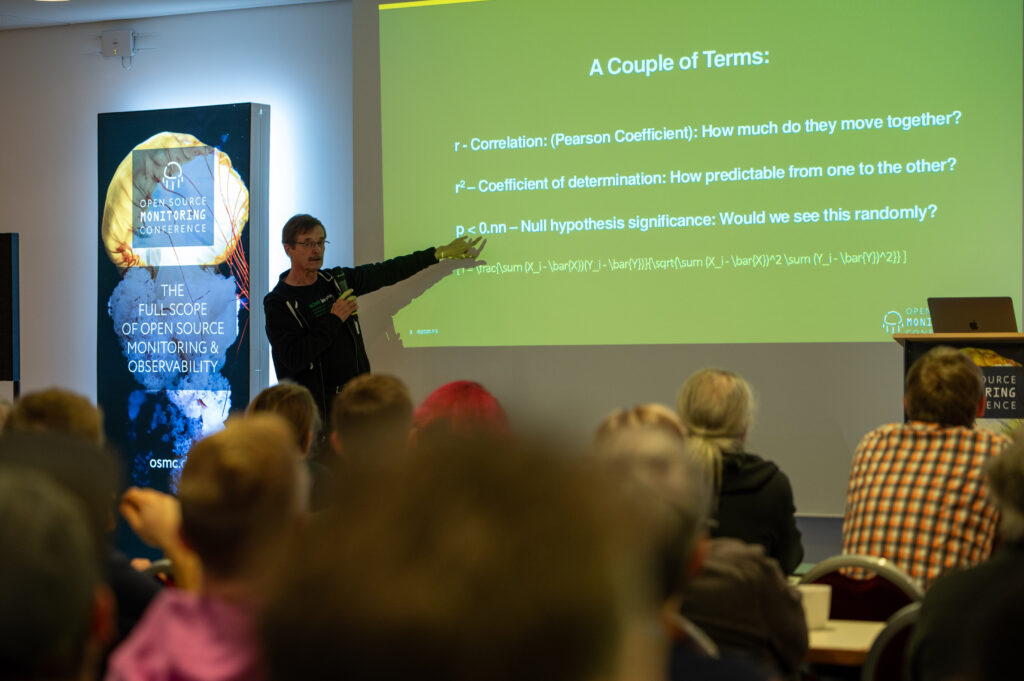
The first Ignite Talk was given by Dave McAllister and was titled „The Conniption Over Correlation„. It explored the fun side of statistics, highlighting the difference between correlation and causation. Dave presented amusing examples such as cats being responsible for wind energy production, Messi’s goals correlating with the French unemployment rate, and the relationship between chocolate consumption and Nobel Prizes.
The talk emphasized that while correlation isn’t causation, people love finding patterns everywhere. It was a humorous and engaging five-minute presentation showcasing some of the wildest correlations on the planet.
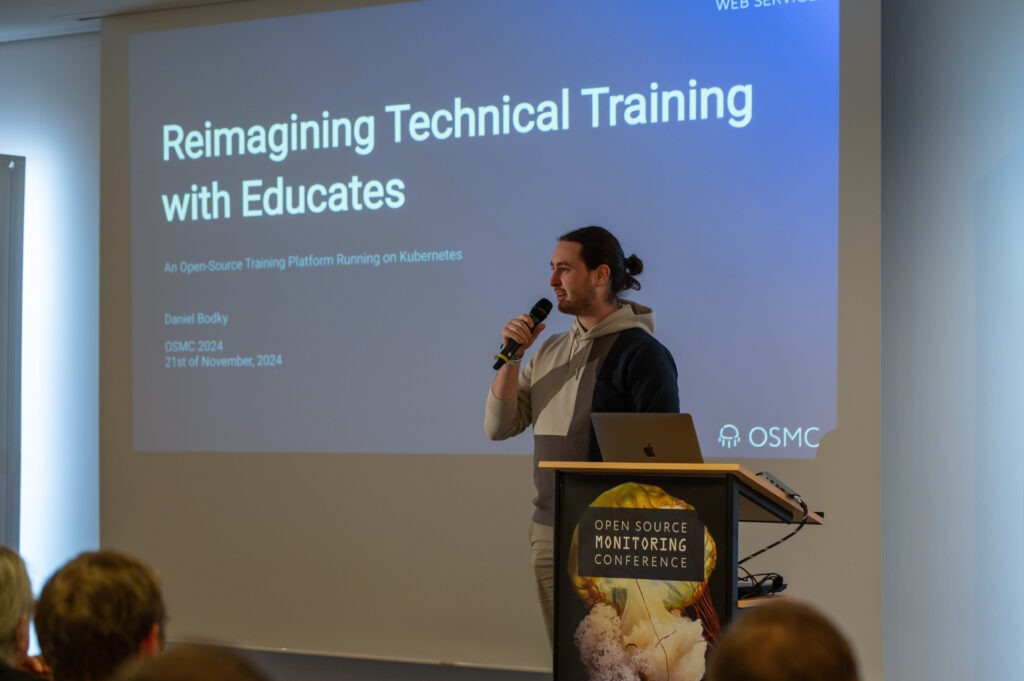
The second Ignite Talk was about „Reimagining Technical Training with Educates“ by Daniel Bodky. He introduced Educates, an open-source platform for creating interactive training environments on Kubernetes.
The platform is public, flexible, and themeable, converting markdown to Hugo for content management. It integrates with VS Code and web-based tools, and supports cluster-side components like Contour and Kyverno CRDs. Educates makes it easy to quickly update training content and provides a versatile playground for technical training. Feel free to test it on playground.nws.netways.de
The final Ignite Talk focused on the key factors for successful 24×7 on-call duty. It covered common challenges in incident management, such as alerting, responsibility handover, and resolution processes. The talk highlighted modern solutions for improving high availability through effective IT monitoring and mobile alerting, using real-life examples and customer stories to illustrate best practices.
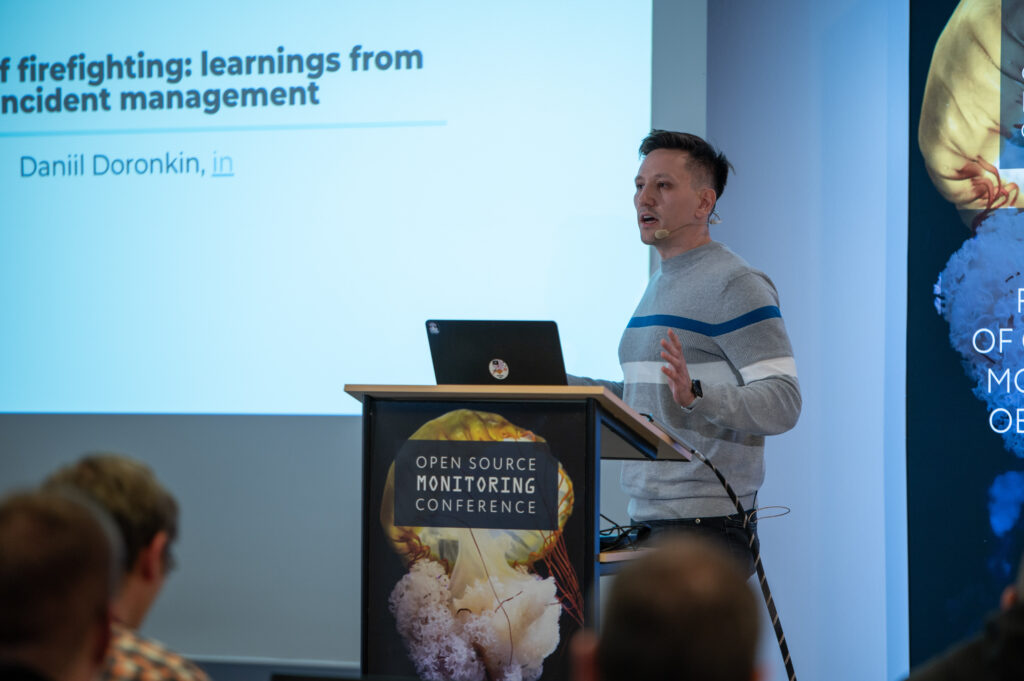
An interesting talk by Daniil Doronkin from Booking.com covered problems in incident management, learnings, and strategies. The speaker discussed the roles and tools involved in incident response, the importance of observability, and the use of dashboards for error prioritization.
Strategies like decision-making trees and post-mortem documentation were highlighted to improve the incident process and prevent future failures. The use of AI for anomaly detection and enhancing CI/CD pipelines was also discussed.
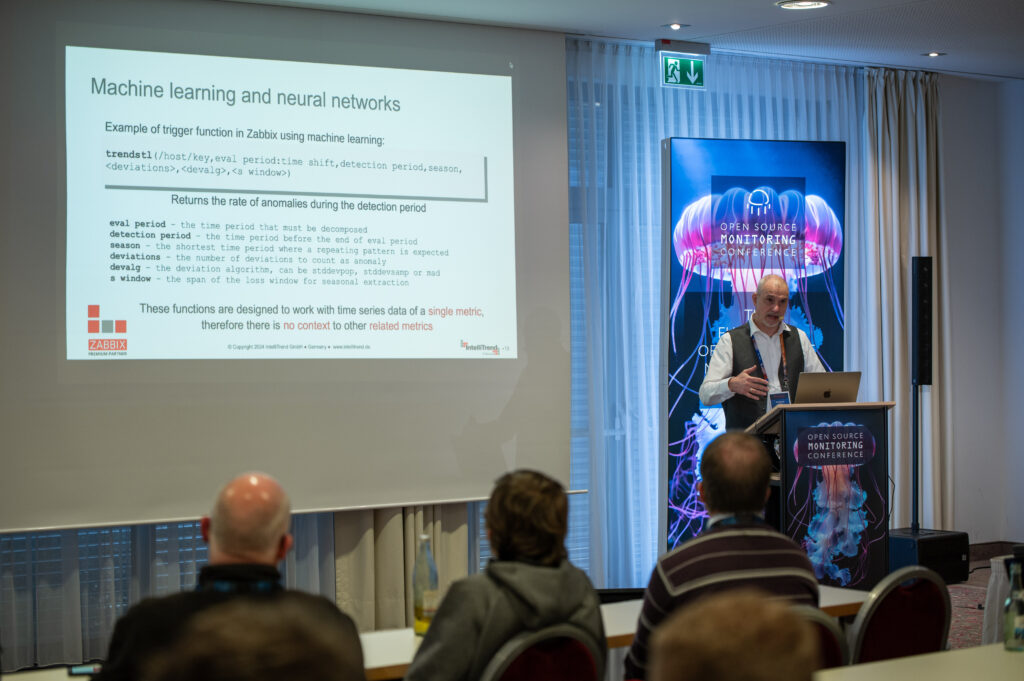
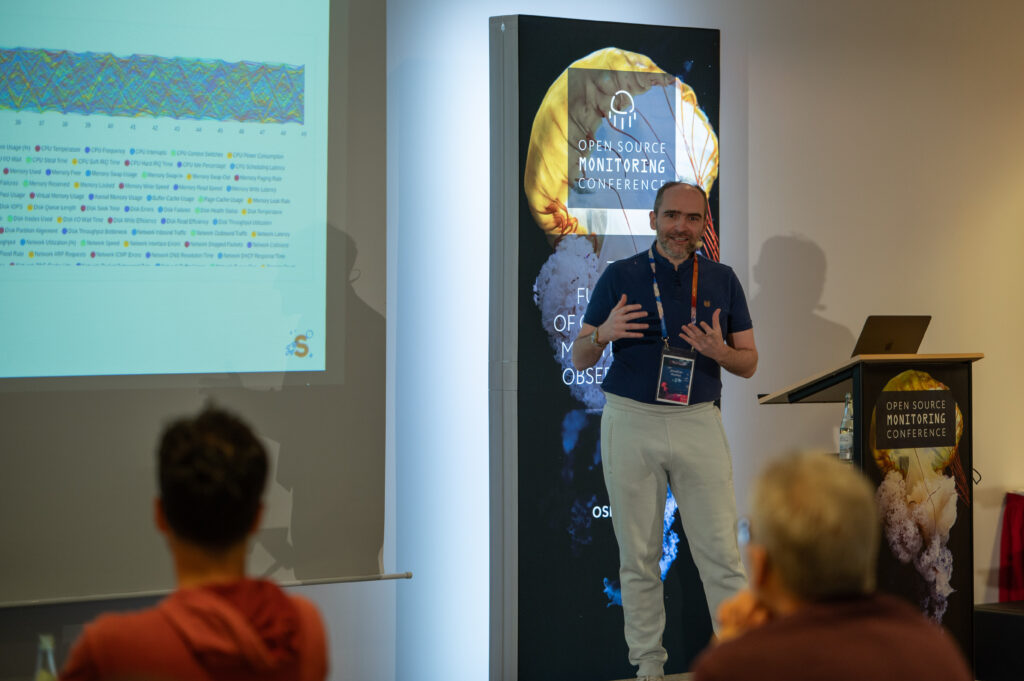
Wolfgang Alper from IntelliTrend discussed how integrating AI and neural networks with Zabbix. He explained that while Zabbix is effective at collecting metrics, defining triggers, and sending alerts, it may miss issues not covered by predefined triggers. By using AI, metrics can be evaluated in a system-specific context to detect anomalies in real-time. The talk covered the differences between AI, machine learning, neural networks, and deep learning, emphasizing the importance of context in data analysis. Wolfgang demonstrated how data from Zabbix can be enriched, normalized, and analyzed using Machine Learning models to identify and respond to anomalies, improving the overall monitoring process.
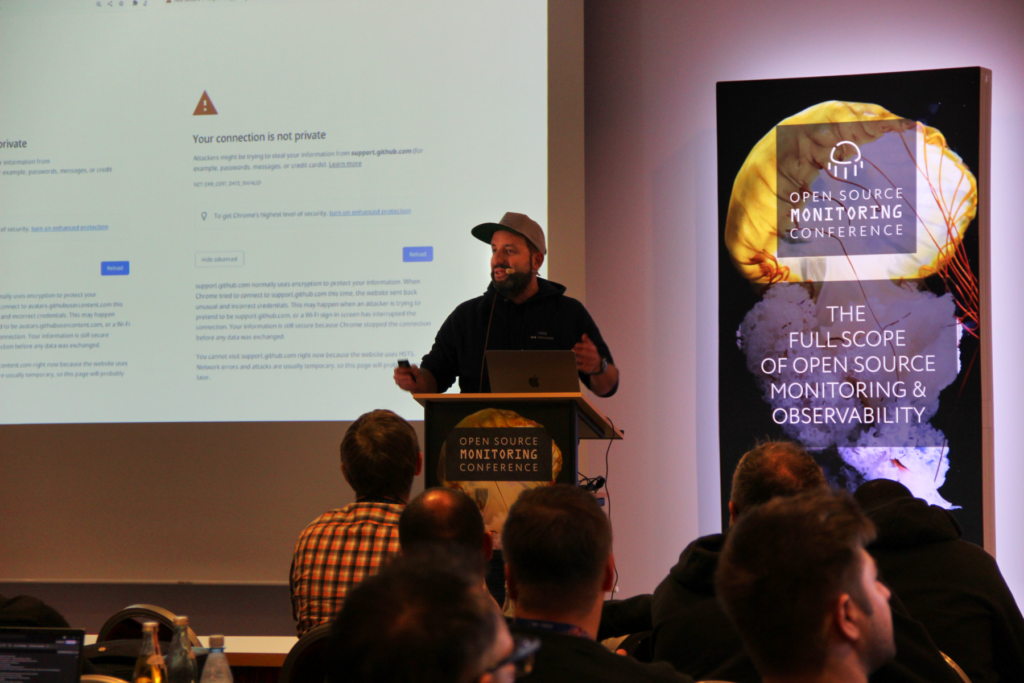
The next talk, Andreas Lehr from We Manage introduced various tools for monitoring web applications from the customer’s perspective. He emphasized the importance of shifting the focus from internal metrics to customer-centric monitoring. Andreas discussed the basics of monitoring certificates, application and browser errors, and performance.
He also highlighted several tools, such as Yellow Lab Tools, Lighthouse metrics, CrUX on BigQuery, Sentry, and synthetic browser tests like playwright, to ensure a comprehensive monitoring approach that truly covers the customer’s experience. For more information check also his personal blog allesnurgecloud.com
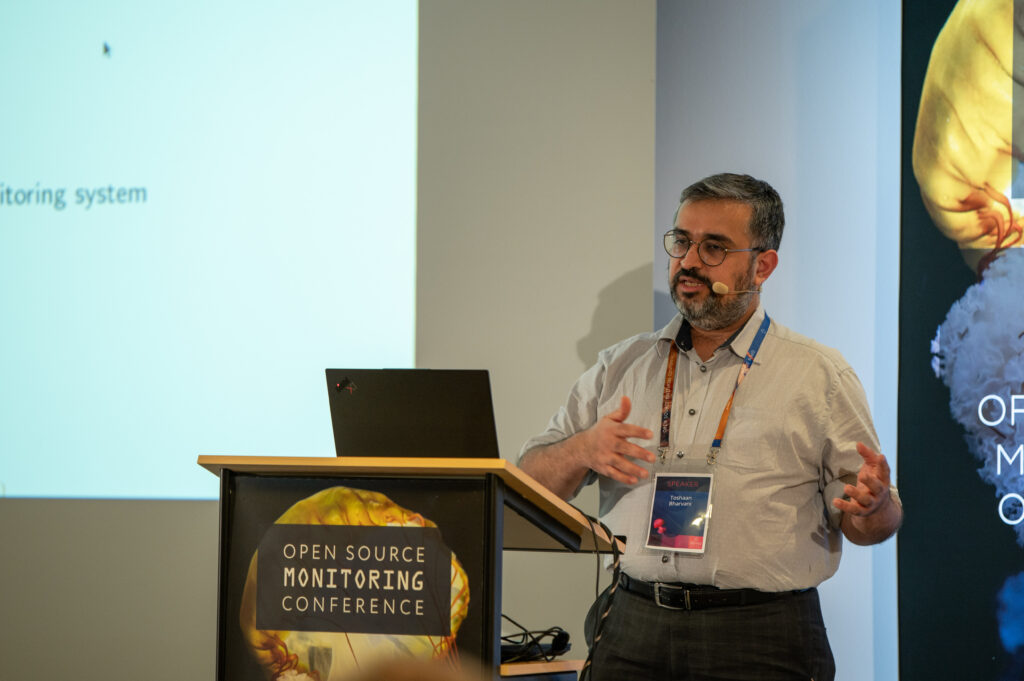
I attended the last talk on this day. Toshaan Bharvani from VanTosh showed how to use Icinga2 as an aggregation tool for monitoring, observability, and dashboarding. The presentation demonstrated how Icinga2 can integrate with other monitoring tools like Zabbix, Broadcom, and Tivoli using API connectors. This integration allows for a unified view of data, customizable dashboards, detailed information, and notifications. The talk also covered the process of using the Icinga2 API for configuration management, sending data to ticketing solutions, and implementing automated remediation and alert escalation. I found the talk very insightful and practical for managing complex monitoring setups.
Thank you for joining us for another inspiring and insightful day at OSMC. We hope you enjoyed it as much as we did! Keep an eye out for the conference archives, which will be available on our website in just a few weeks.


0 Kommentare