![]() I’m always trying to look into new devops tools and how they fit best with Icinga 2 as a monitoring solution. Often demanded is an integration with Elastic Stack and Elastic Beats with Icinga 2. Gathering metrics and events, correlated to additional input sources analysing a greater outage and much more.
I’m always trying to look into new devops tools and how they fit best with Icinga 2 as a monitoring solution. Often demanded is an integration with Elastic Stack and Elastic Beats with Icinga 2. Gathering metrics and events, correlated to additional input sources analysing a greater outage and much more.
Last week the first 5.0.0 beta1 release hit my channels and I thought I’d give it a try. The installation is pretty straight forward using packages. Note: This is my first time installing Elastic Stack, still have little knowledge from colleague hero stories and the OSDC talk by Monica Sarbu and earlier conferences.
Requirements
Install Java 1.8.0 as a requirement. I’m using a Centos 7 VM here with the EPEL repository enabled.
# yum install -y java
Setup Elasticsearch
Fetch the latest RPM package and install it. It nicely integrates with Systemd, no more hassle with starting it in foreground as suggested in the docs.
# yum install -y https://artifacts.elastic.co/downloads/elasticsearch/elasticsearch-5.0.0-beta1.rpm
# systemctl daemon-reload
# systemctl enable elasticsearch.service
Reduce the memory heap size usage for a small demo VM.
vim /etc/elasticsearch/jvm.options
# Xms represents the initial size of total heap space
# Xmx represents the maximum size of total heap space
-Xms512m
-Xmx512m
Start Elasticsearch.
# systemctl start elasticsearch.service
Test whether the service is talking REST on port 9200.
# curl -X GET http://localhost:9200/
{
  "name" : "-ikeg-B",
  "cluster_name" : "elasticsearch",
  "cluster_uuid" : "5sZaEqBnST2tW7G3Vo1slg",
  "version" : {
    "number" : "5.0.0-beta1",
    "build_hash" : "7eb6260",
    "build_date" : "2016-09-20T23:10:37.942Z",
    "build_snapshot" : false,
    "lucene_version" : "6.2.0"
  },
  "tagline" : "You Know, for Search"
}
Setup Logstash
Straight forward package installation. Specific configuration will be added later.
# yum install -y https://artifacts.elastic.co/downloads/logstash/logstash-5.0.0-beta1.rpm
# systemctl enable logstash.service
# systemctl start logstash.service
Setup Kibana
Install the latest RPM package. Kibana listens on localhost by default, change that to „0.0.0.0“.
# yum -y install https://artifacts.elastic.co/downloads/kibana/kibana-5.0.0-beta1-x86_64.rpm
# vim /etc/kibana/kibana.yml
server.host: "0.0.0.0"
# systemctl start kibana
Configure Logstash to accept Beats input
Create a new configuration file underneath /etc/logstash/conf.d. Define „beats“ as input listening on port 5044. The output is set to „elasticsearch“ according to the documentation. Once finished, restart the logstash service.
# vim /etc/logstash/conf.d/logstash.conf
input {
  beats {
    port => "5044"
    client_inactivity_timeout => "1000"
  }
}
output {
  elasticsearch {
    hosts => "localhost:9200"
    manage_template => false
    index => "%{[@metadata][beat]}-%{+YYYY.MM.dd}"
    document_type => "%{[@metadata][type]}"
  }
}
# systemctl restart logstash
Setup Filebeat
Beats are small collector daemons which gather metrics and logs from your system. In this example I’m installing Filebeat to just collect logs. Nice one – again Systemd services for easier handling.
# yum install -y https://artifacts.elastic.co/downloads/beats/filebeat/filebeat-5.0.0-beta1-x86_64.rpm
# systemctl enable filebeat
# systemctl start filebeat
Configure Filebeat
My demo VM has Icinga 2 with some sample configuration pre-installed. I’ll use these logs to generate input for the Filebeat collector. By default the Filebeat configuration will attempt to write to Elasticsearch directly. I’ll change that to Logstash for additional parsing/tagging. More details in the documentation.
# vim /etc/filebeat/filebeat.yml
filebeat.prospectors:
- input_type: log
  paths:
    - /var/log/*.log
    - /var/log/messages
    - /var/log/icinga2/*.log
  fields:
    type: syslog
output.logstash:
  hosts: ["localhost:5044"]
# systemctl restart filebeat
# tail -f /var/log/filebeat/filebeat
Import Beats dashboards into Kibana
This comes in handy for configuring the required index patterns in Kibana. Proceed as described in the documentation.
# /usr/share/filebeat/scripts/import_dashboards
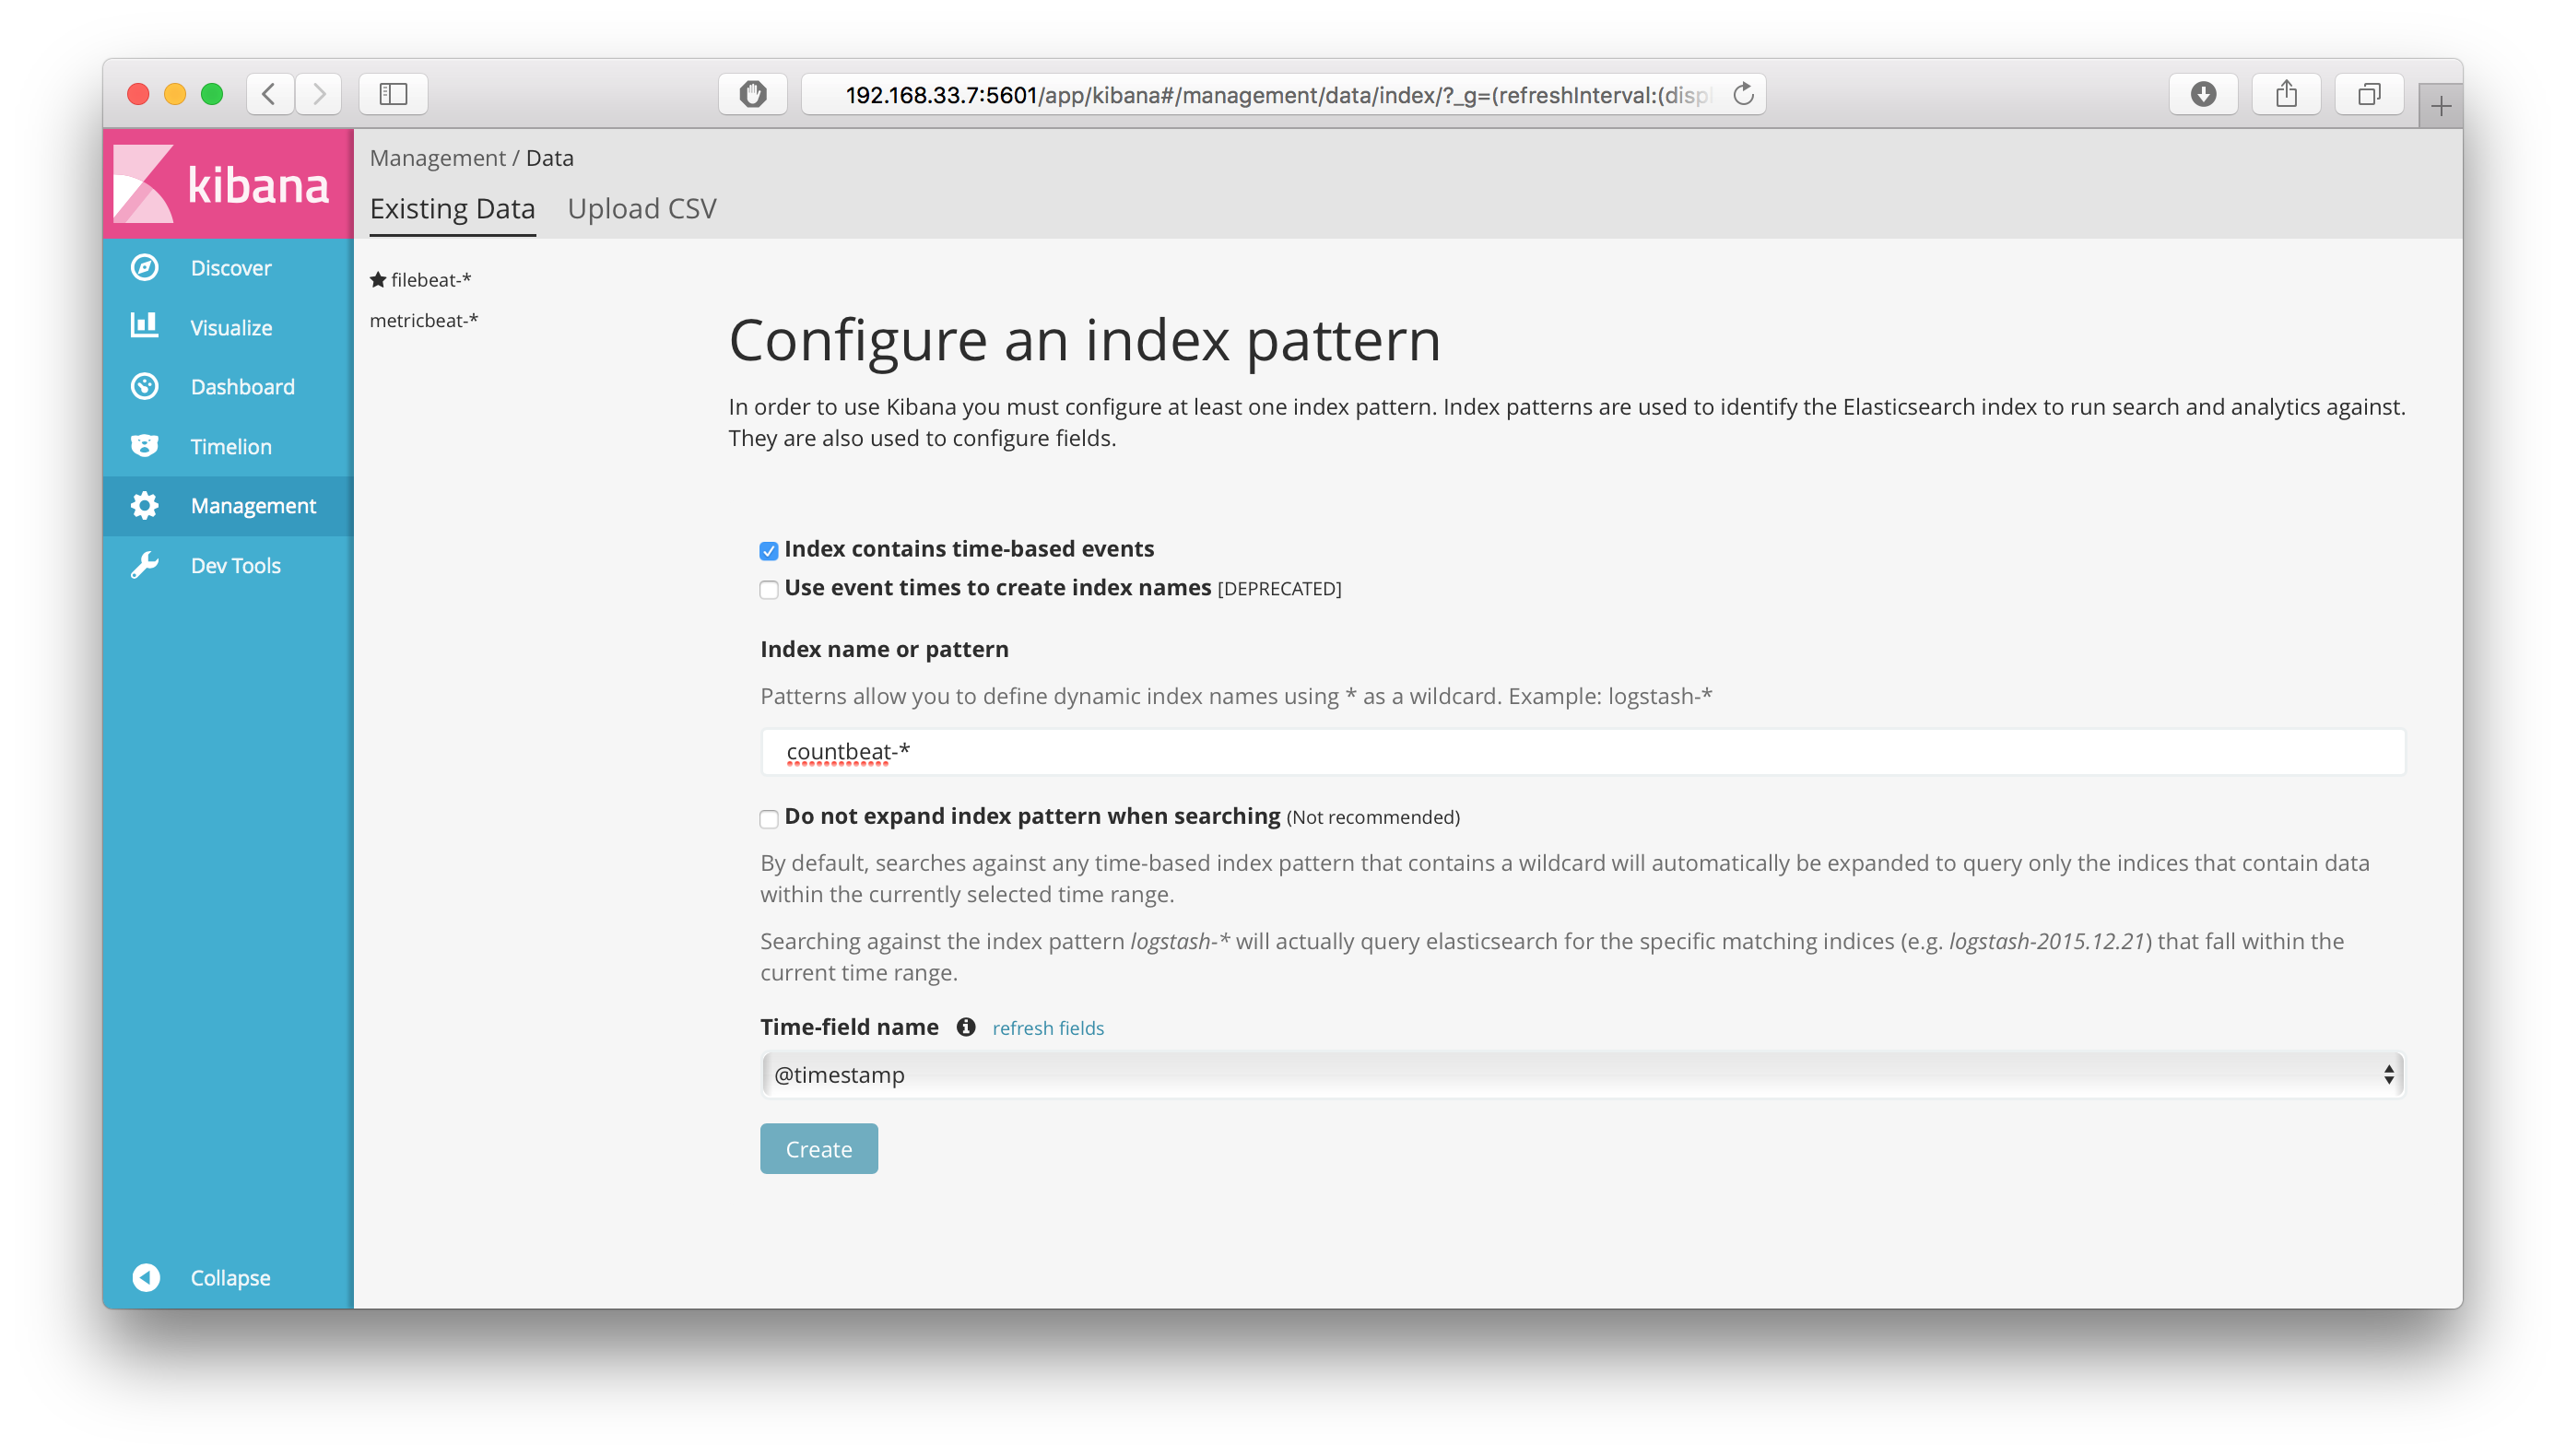
Configure Kibana
Navigate to http://yourhost:5601 and configure a default index pattern for „filebeat-*“.


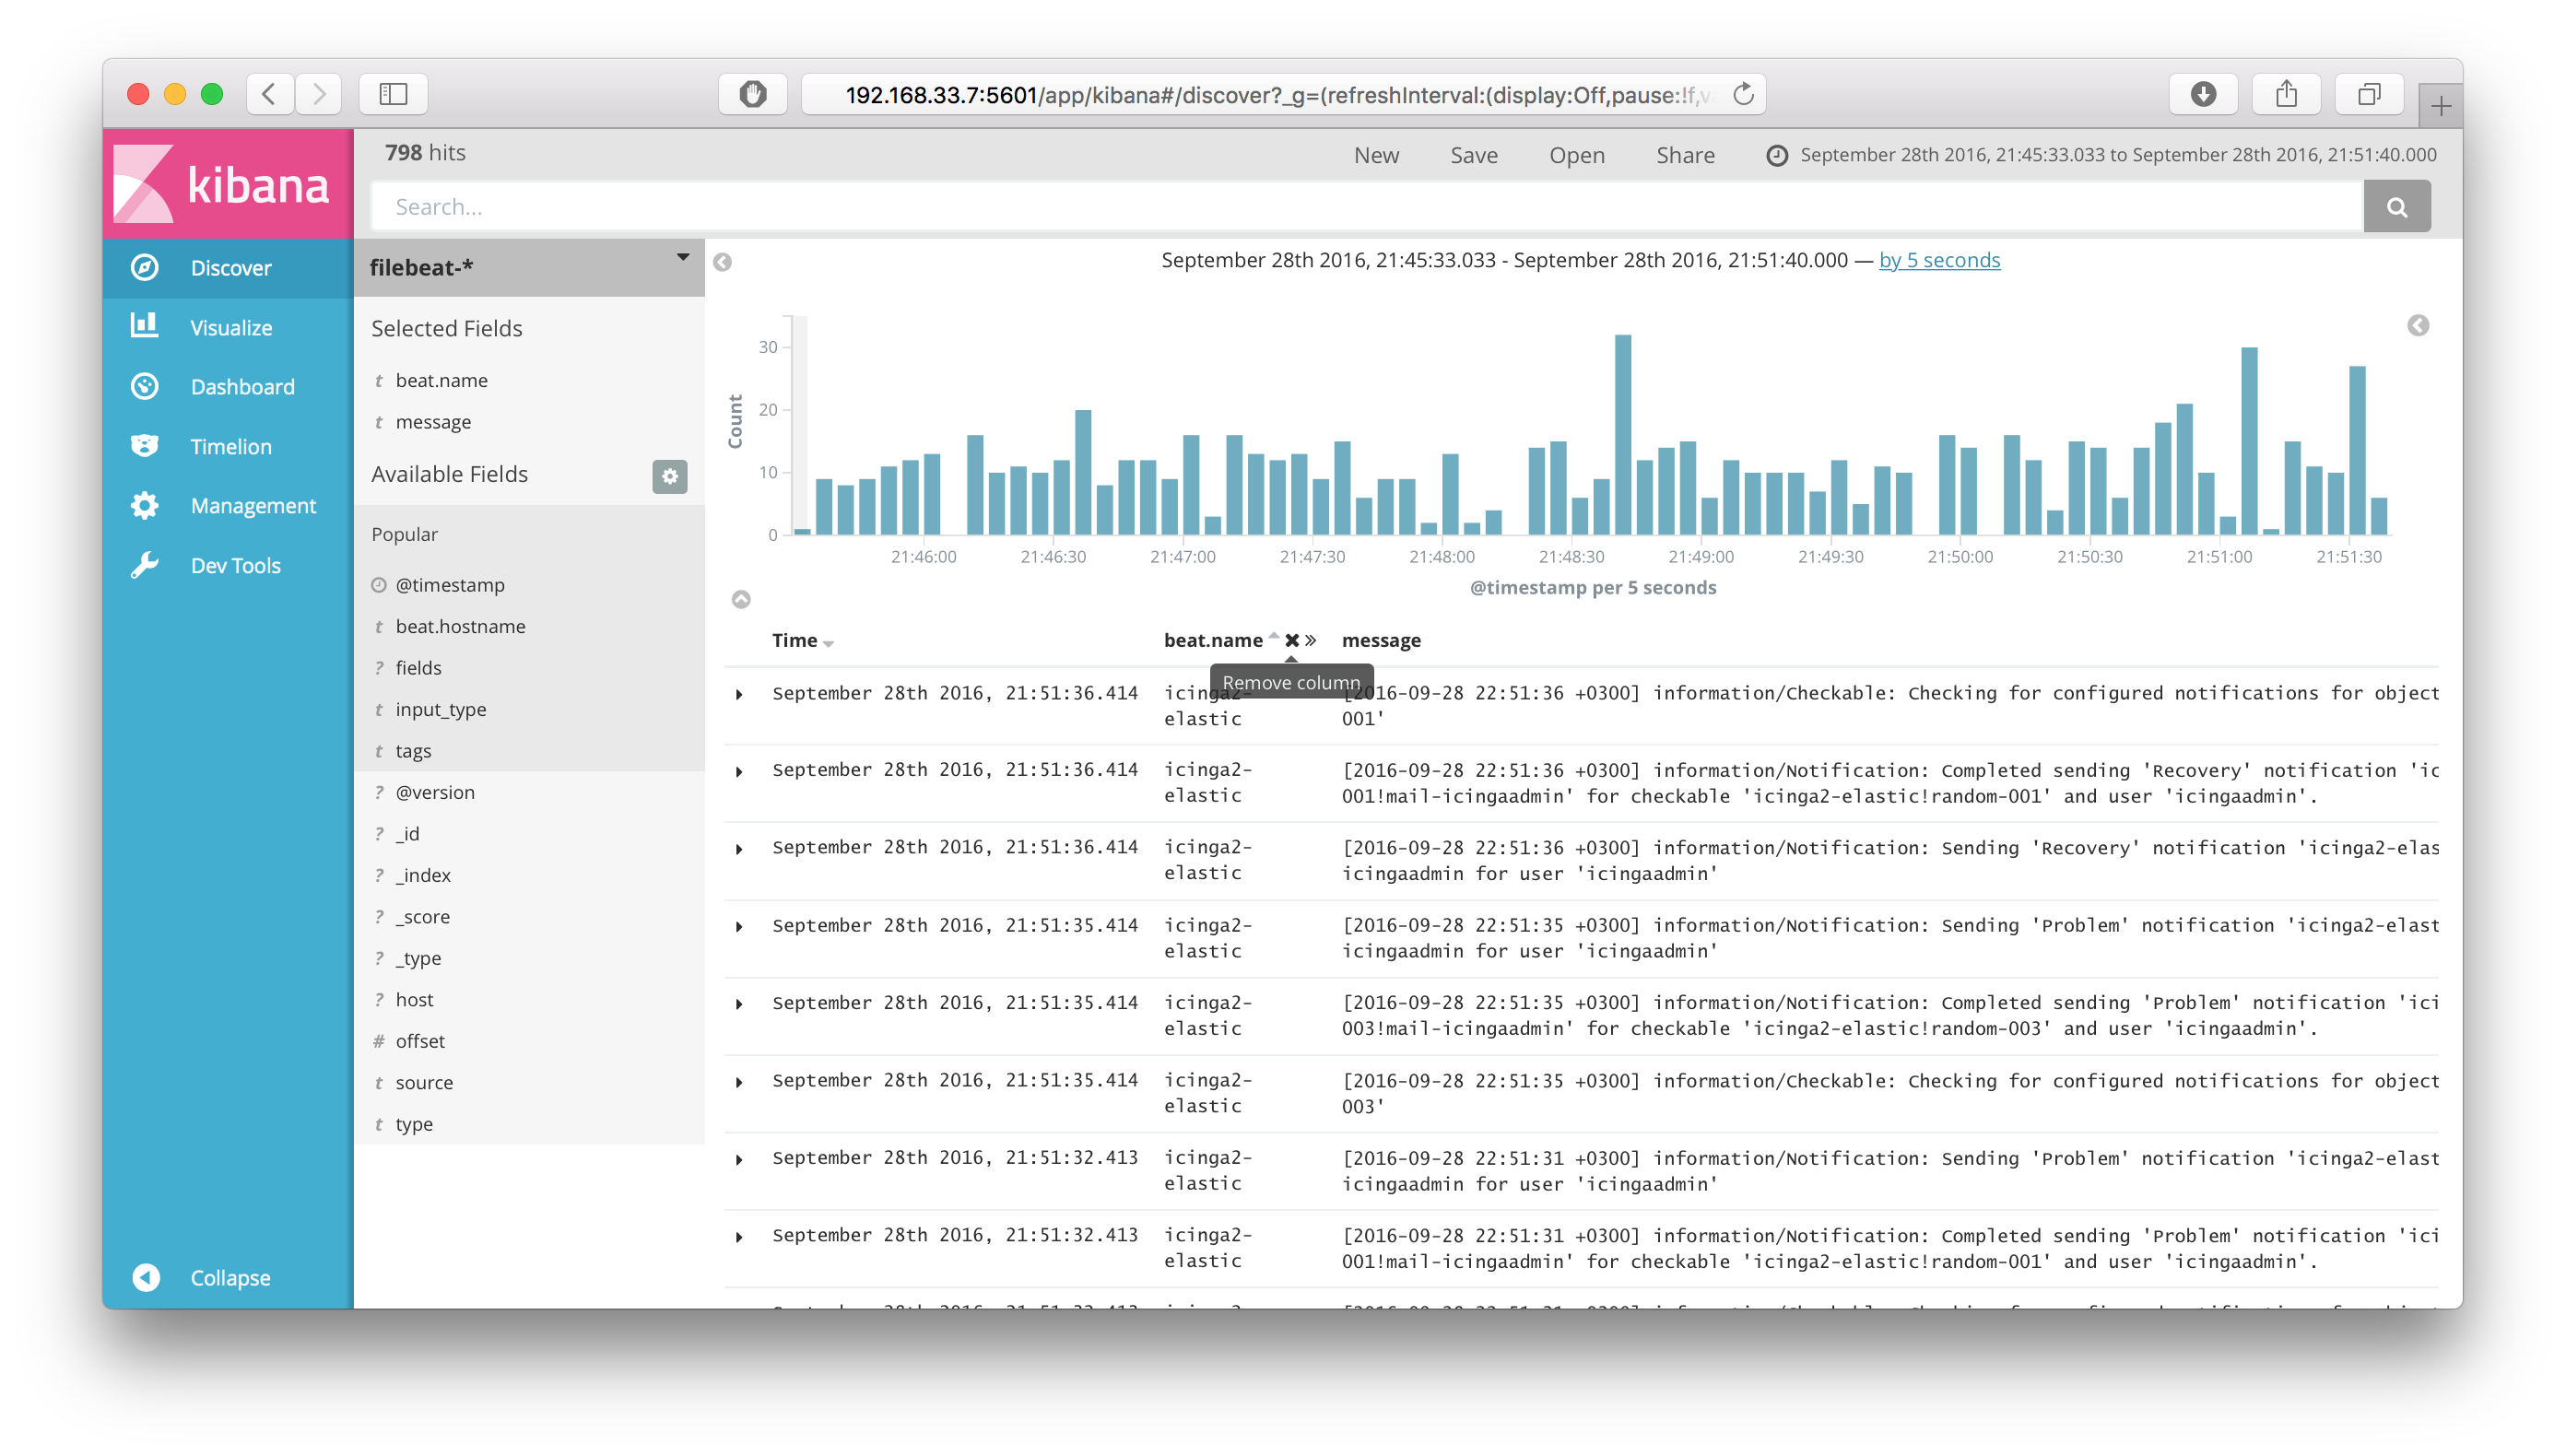
Test Filebeat
While testing Filebeat I found a bug in the beta1 release which causes Logstash to terminate idle connections from Filebeat with EOF. The workaround suggests to configure the Logstash beats input with client_inactivity_timeout>900 – works again.
The screenshot highlights the latest log messages coming from Icinga 2 (icinga2.log).
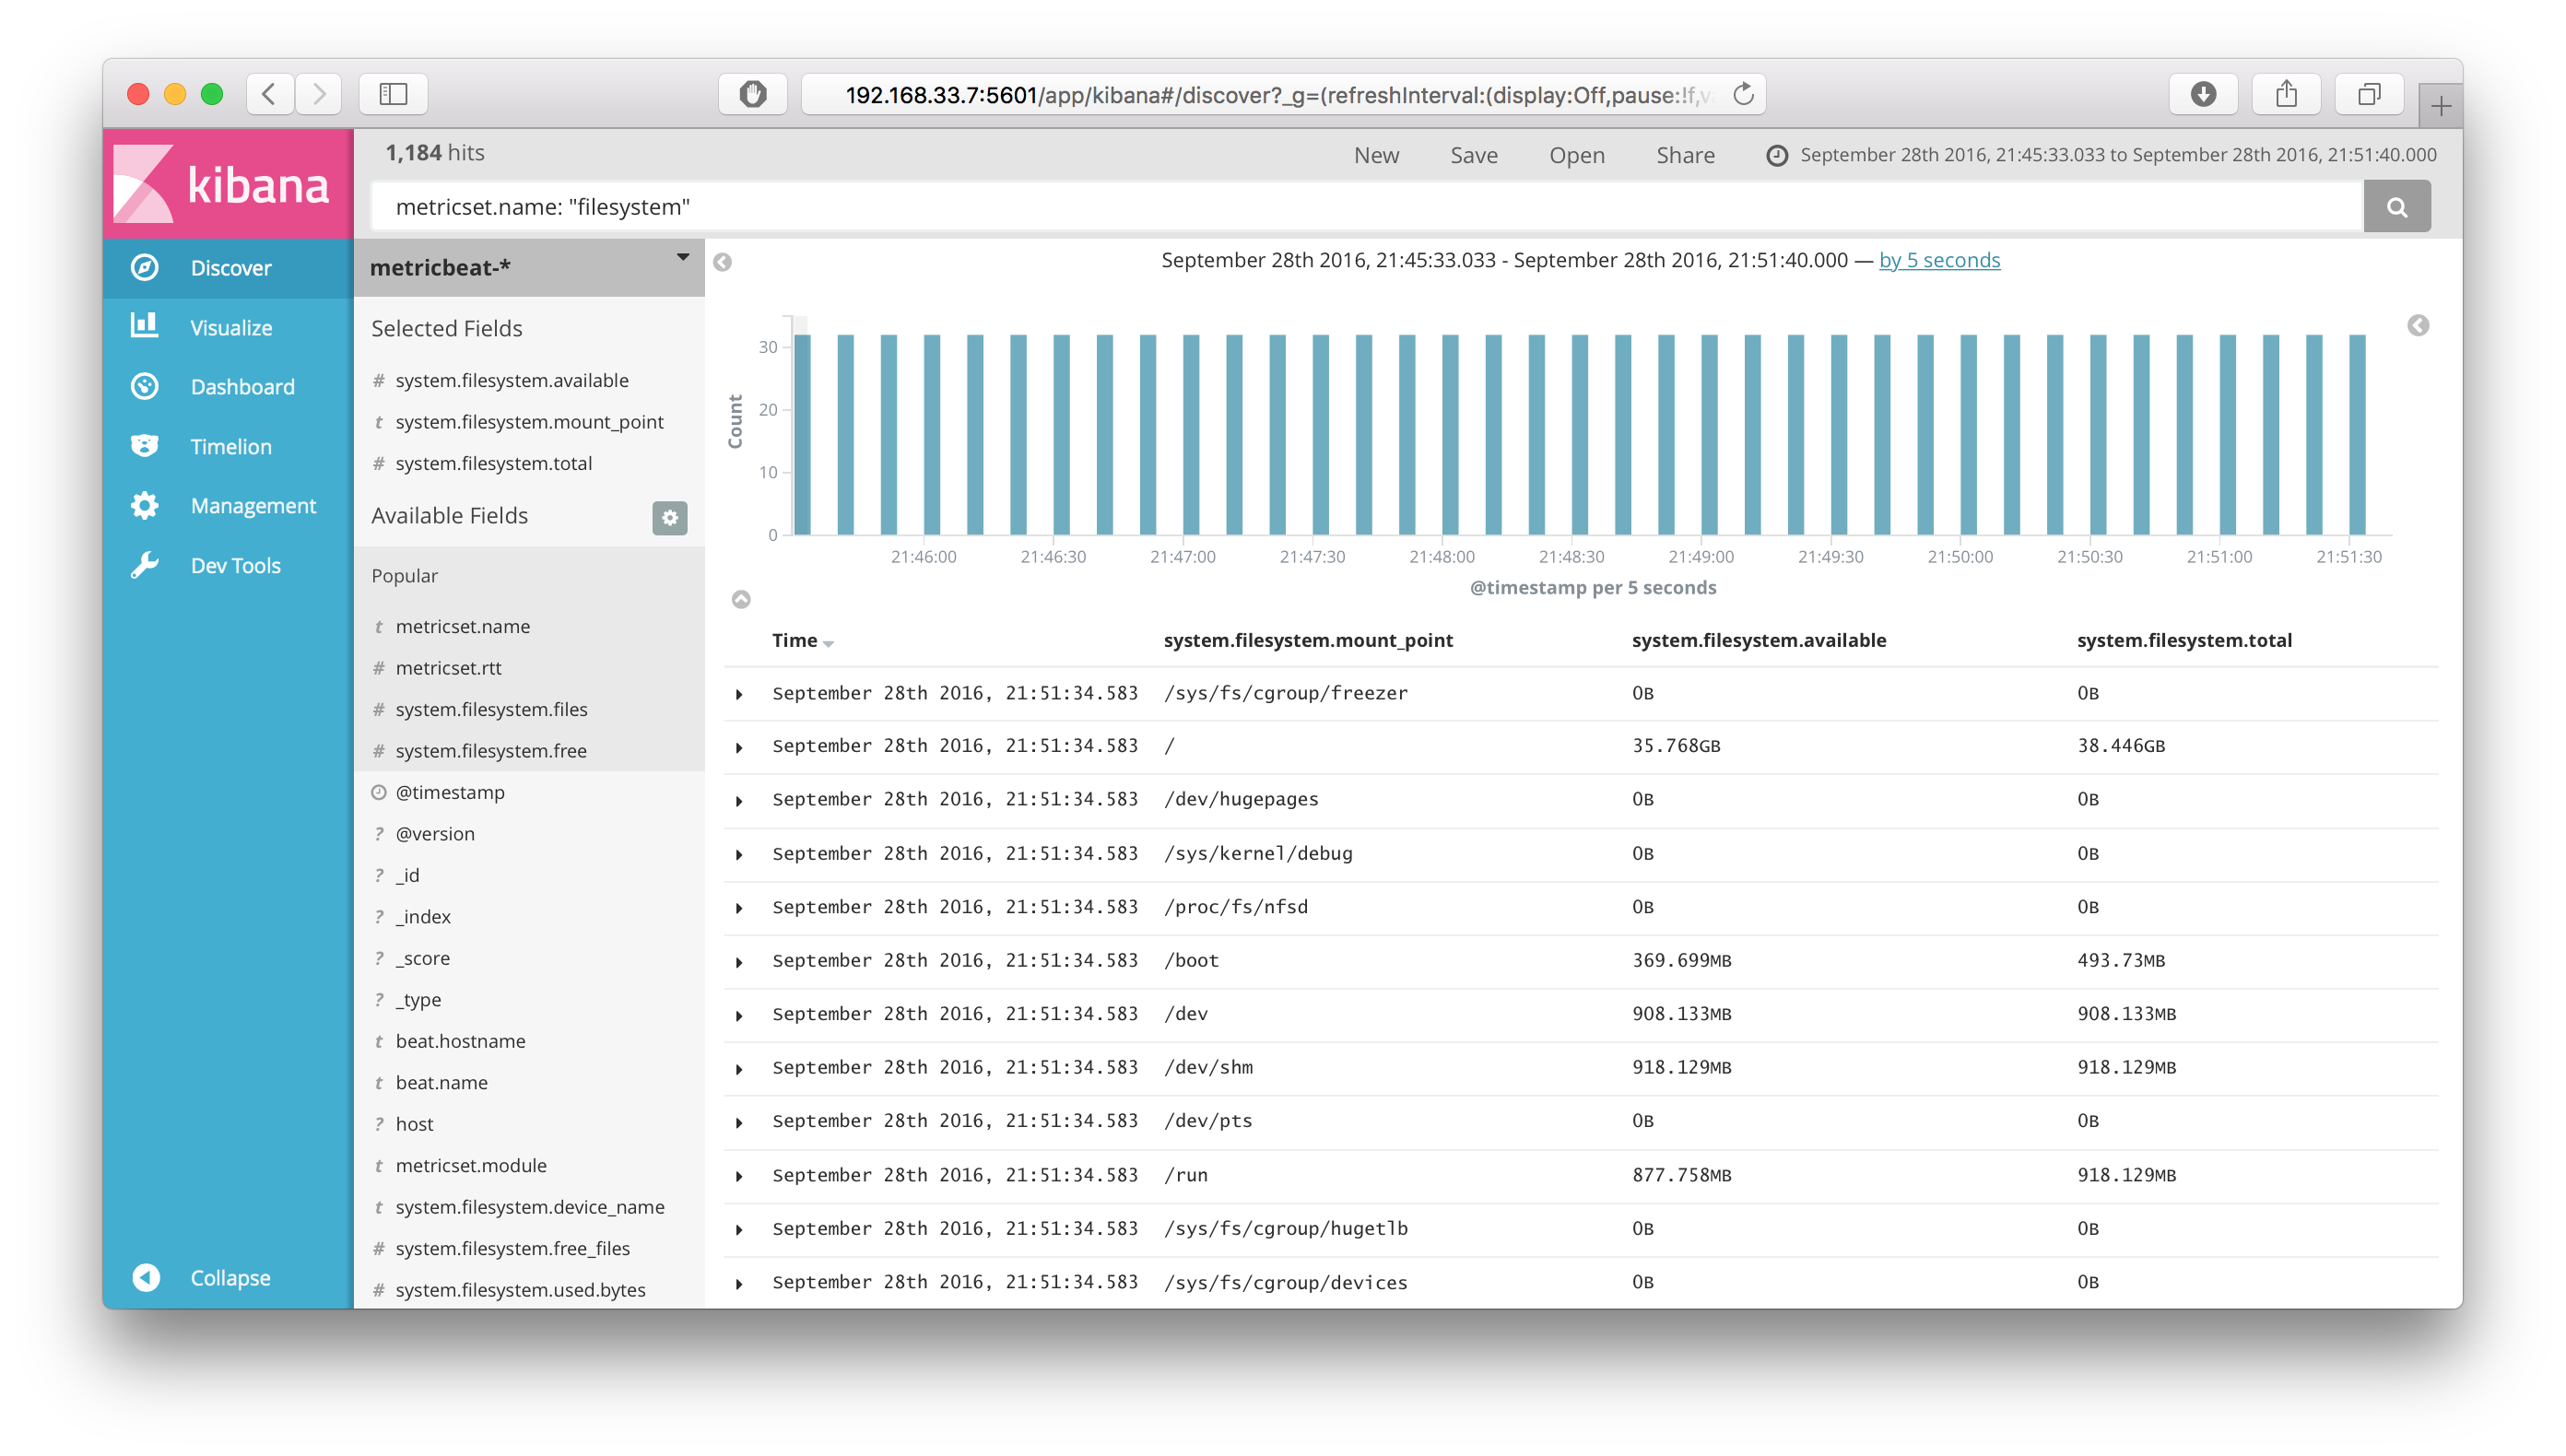
More Beats
Topbeat is going to be replaced by Metricbeat. The latter is still experimental but allows you to play with advanced metric collection.
# yum install -y https://artifacts.elastic.co/downloads/beats/metricbeat/metricbeat-5.0.0-beta1-x86_64.rpm
# vim /etc/metricbeat/metricbeat.yml
...
output.logstash:
  hosts: ["localhost:5044"]
# systemctl enable metricbeat
# systemctl start metricbeat
# /usr/share/metricbeat/scripts/import_dashboards
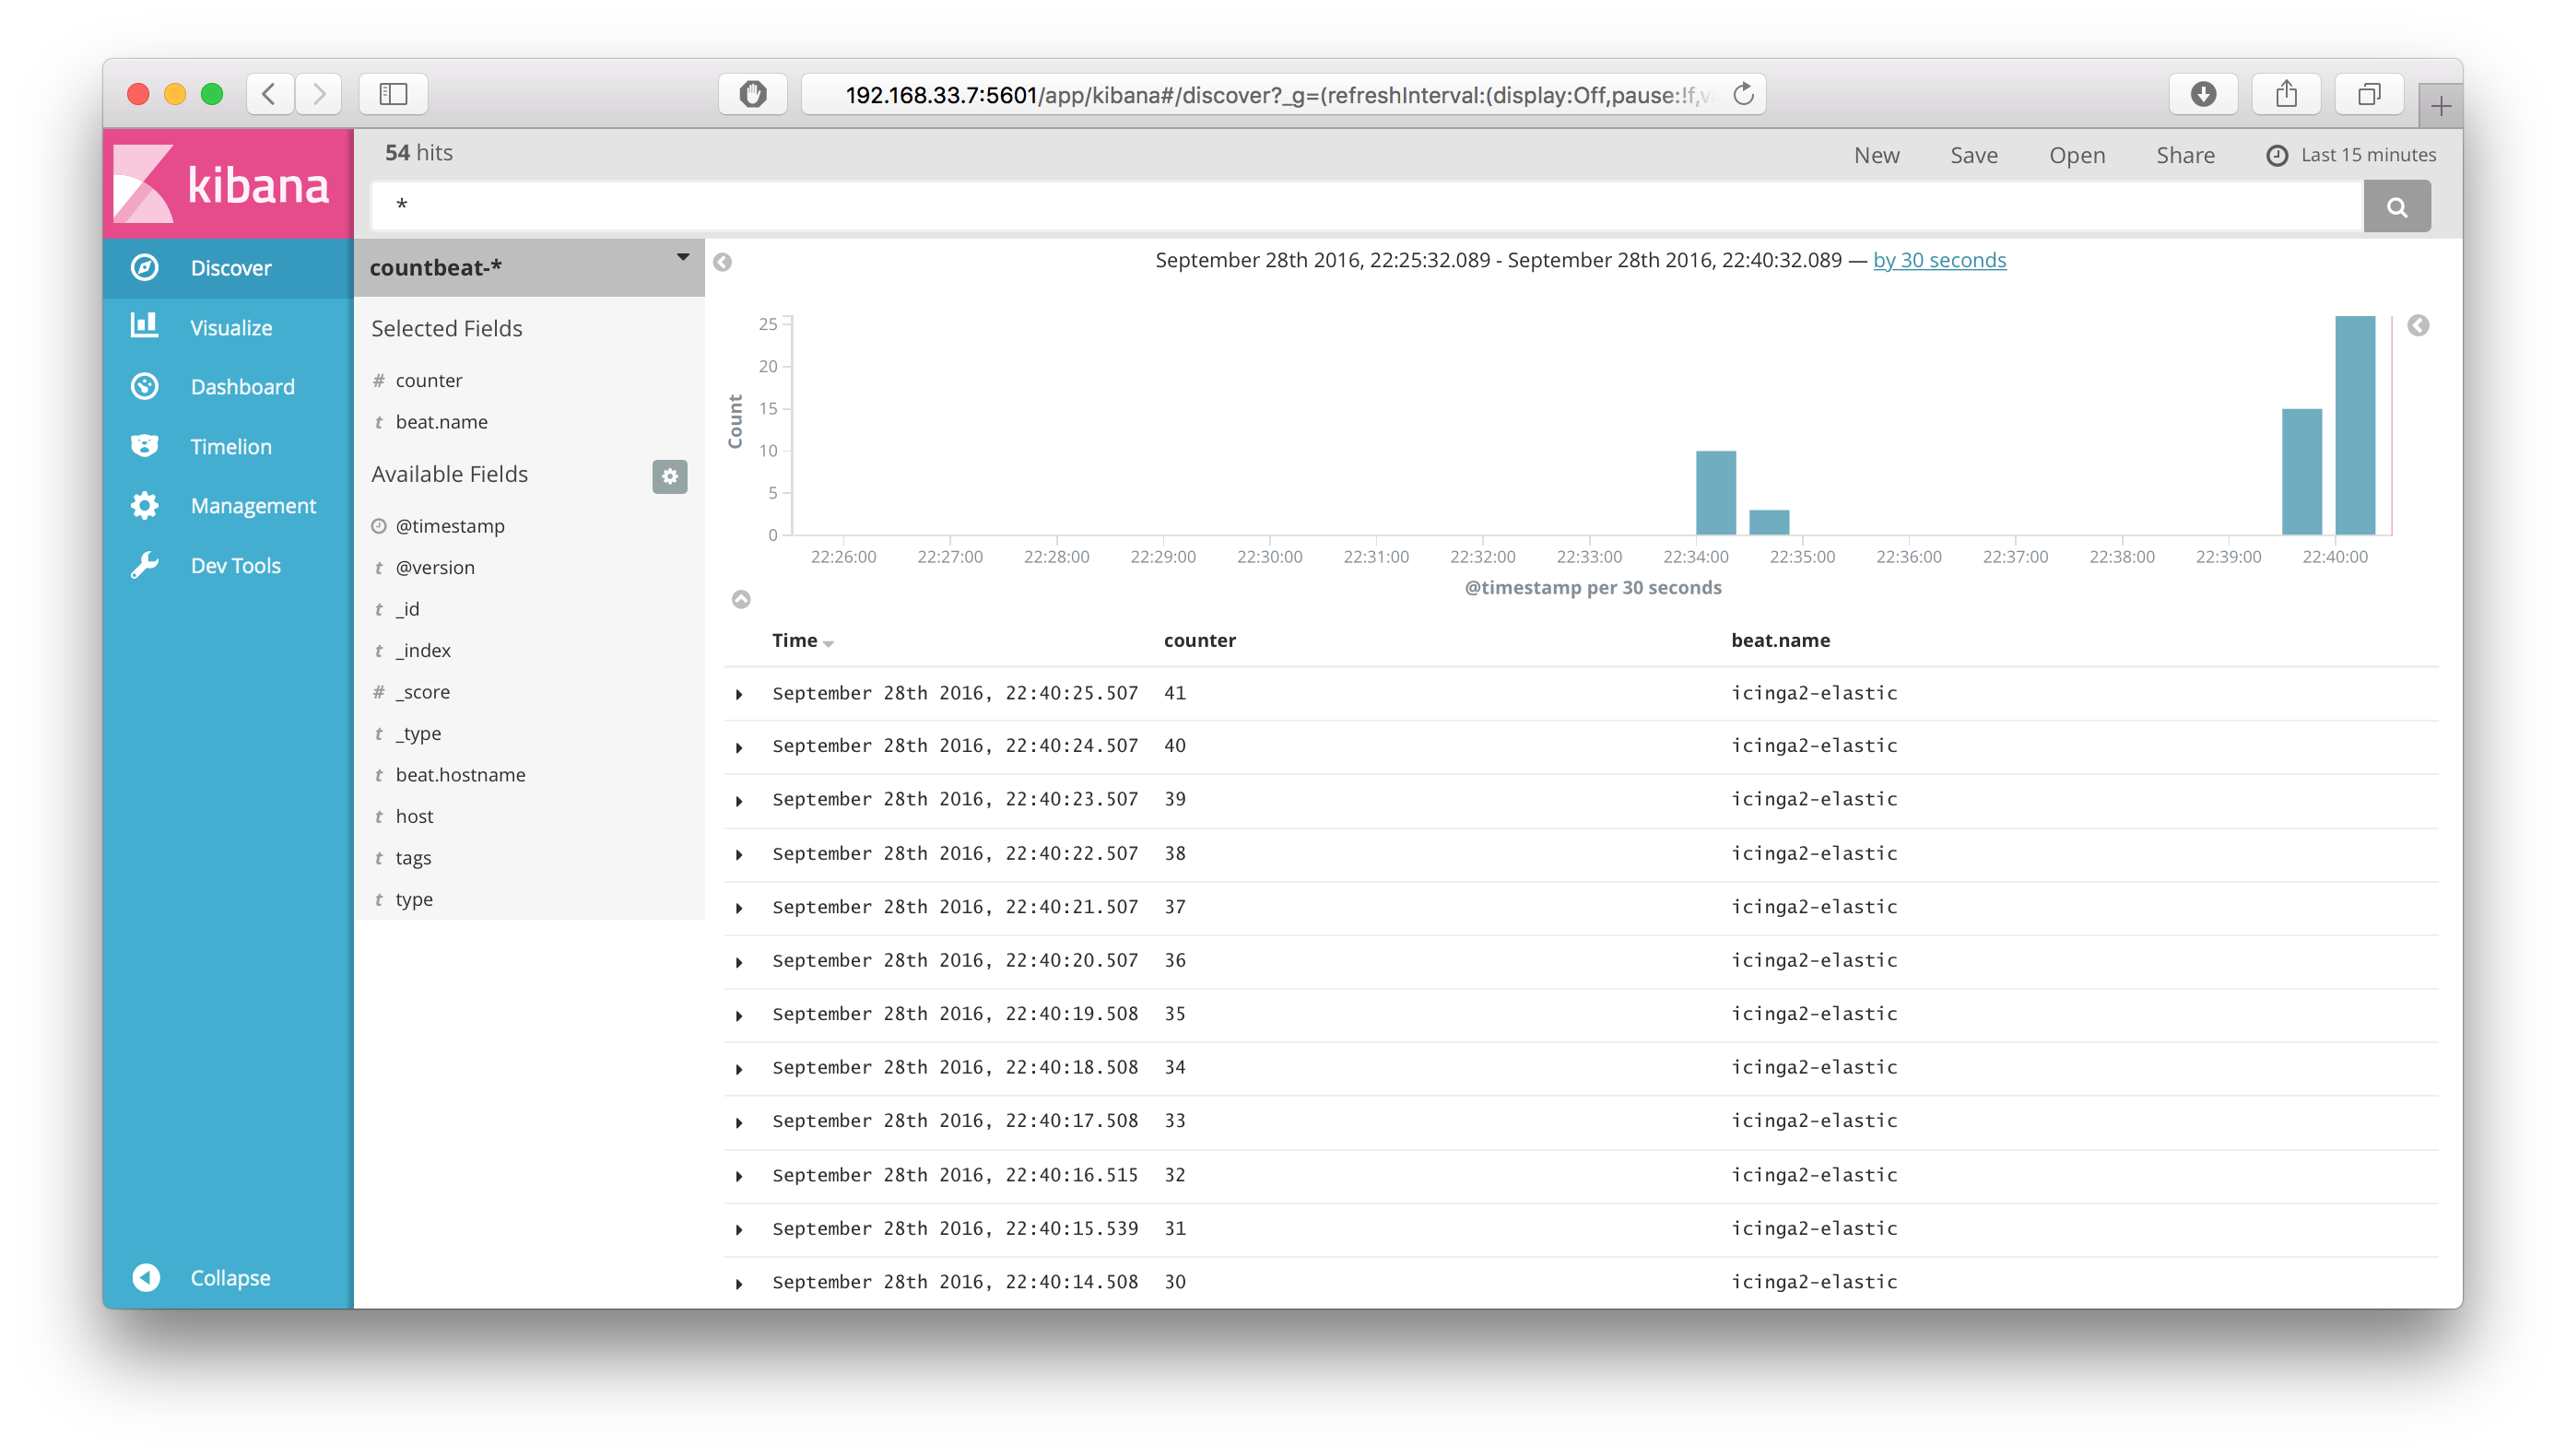
I’m a Golang beginner, but it shouldn’t be too hard to learn it when you know C++. The Beats already out there look fairly promising. I’ve found for example nagioscheckbeat which executes the Icinga monitoring plugins.
The nice thing is that there is libbeat as framework already, and lots of documentation on how to create your own beats skeleton. I’ve tried to create the „countbeat“ example – works like a charm. Let’s see where my journey goes in the future 😉
mkdir $HOME/work
export GOPATH=$HOME/work
go get github.com/elastic/beats
mkdir $GOPATH/src/github.com/dnsmichi
cd $GOPATH/src/github.com/dnsmichi
yum install -y python-pip python-virtualenv
pip install cookiecutter
# cookiecutter $GOPATH/src/github.com/elastic/beats/generate/beat
project_name [Examplebeat]: Countbeat
github_name [your-github-name]: dnsmichi
beat [countbeat]:
beat_path [github.com/dnsmichi]:
full_name [Firstname Lastname]: Michael Friedrich
# cd $GOPATH/src/github.com/dnsmichi/countbeat
# make setup
# make
# vim countbeat.yml
output.logstash:
  hosts: ["localhost:5044"]
# curl -XPUT 'http://localhost:9200/_template/countbeat' -d@countbeat.template.json
# ./countbeat -e -d "*"
2016/09/28 20:34:41.332237 output.go:109: DBG  output worker: publish 1 events
2016/09/28 20:34:41.332272 sync.go:107: DBG  Try to publish 1 events to logstash with window size 10
2016/09/28 20:34:41.332691 client.go:183: DBG  Publish: {
  "@timestamp": "2016-09-28T20:34:41.332Z",
  "beat": {
    "hostname": "icinga2-elastic",
    "name": "icinga2-elastic"
  },
  "counter": 4,
  "type": "countbeat"
}
2016/09/28 20:34:41.332721 countbeat.go:54: INFO Event sent
2016/09/28 20:34:41.334081 sync.go:78: DBG  1 events out of 1 events sent to logstash. Continue sending
2016/09/28 20:34:41.334103 single.go:150: DBG  send completed
Conclusion
I’m eagerly awaiting the stable 5.0 release, working with the latest and greatest stuff. Meanwhile I’m going to test the beta release in deep, especially in terms of a LogstashWriter feature for Icinga 2 or for preparing a shiny Vagrant box.
We’re thrilled about Monica Sarbu’s OSMC talk on Elastic Beats and of course the OSMC hackathon to work on Beats integration with Icinga 2 and much more. Make sure to join us!
In case you are looking for an in-depth training for configuring Elastic Stack for your environment, my colleagues provide awesome training courses including 5.x already 🙂


0 Kommentare
Trackbacks/Pingbacks