


For me OSMC started with the workshop „Using and understanding Wazuh“ where my colleagues Christian Stückl and Felix Nirsberger teamed up which gave a great introduction and overview. Thanks to a no-show I also got a spot in the Whiskey tasting which was sponsored by B1 systems and done by Gelbes Haus. The tasting gave a nice introduction to whiskey by giving a six dram tour starting in the Lowlands and ending at Islay. It was a nice way to network.
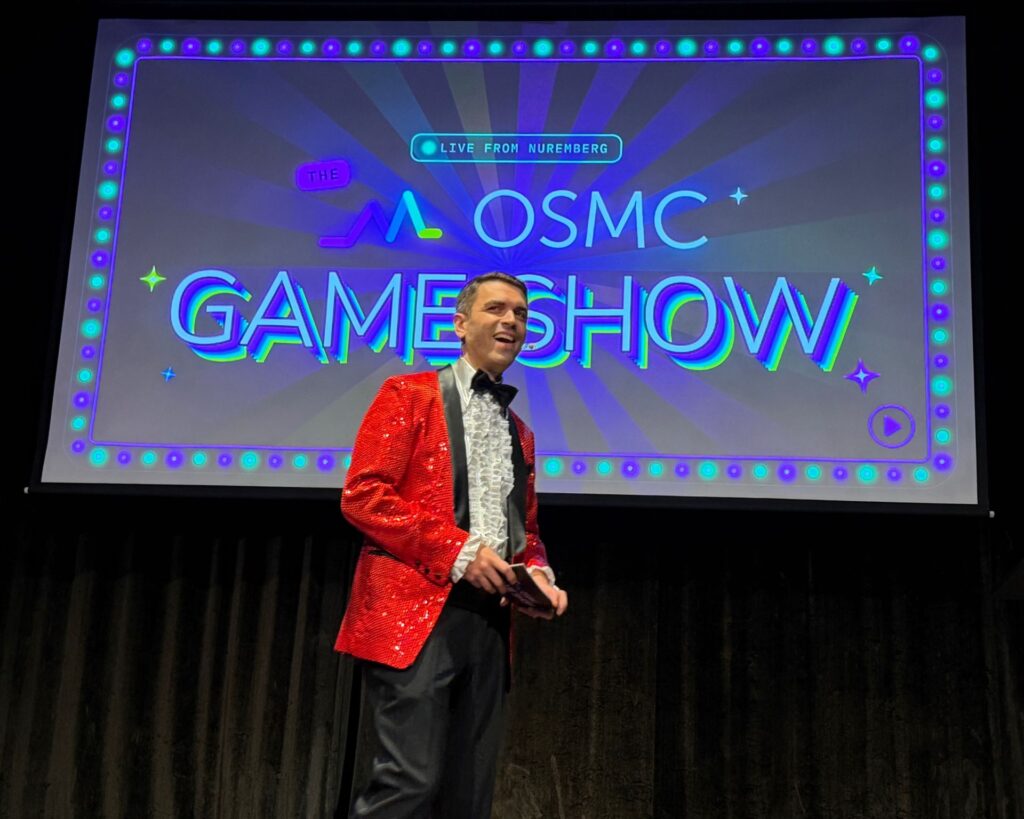
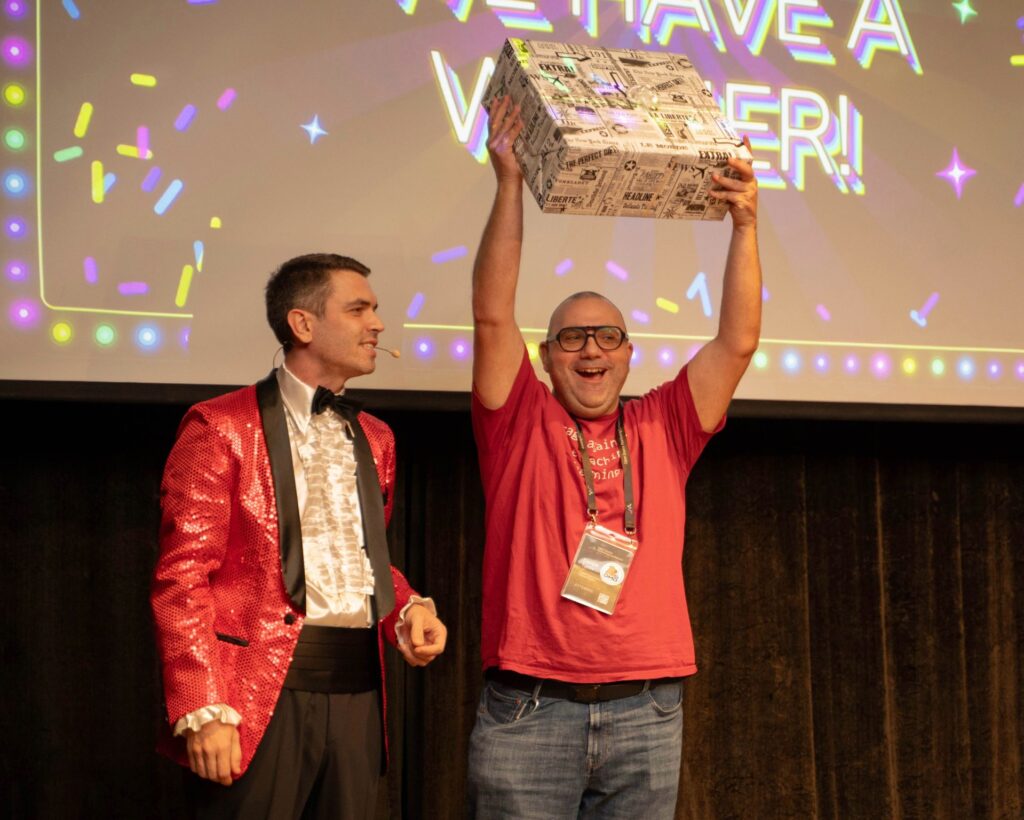
This was already a good start but day 1 also delivered what OSMC stands for. You can read the recap of my colleague Angelika Bang for more details. I really enjoyed the mix of the classic case studies and the expected how to improve your environment with AI. My personal highlight was as always the „Current State of Icinga“ now done by Blerim, followed by Christian’s „Icinga for Windows – A New Dawn“ and „Monitoring Agents: Where Do You Even Start?“ by Dominik Schmidle. The Evening event at PARKS was also excellent, nice food, good drinks, networking and a Quiz show what else would you want. I was especially proud when I even saw one of the second year trainees already networking like a pro.
So now it is my turn again to provide you an overview of day 2, so I hope you enjoy the read. Make sure to follow the links to get even more details if a topic catches your interest.
The Morning
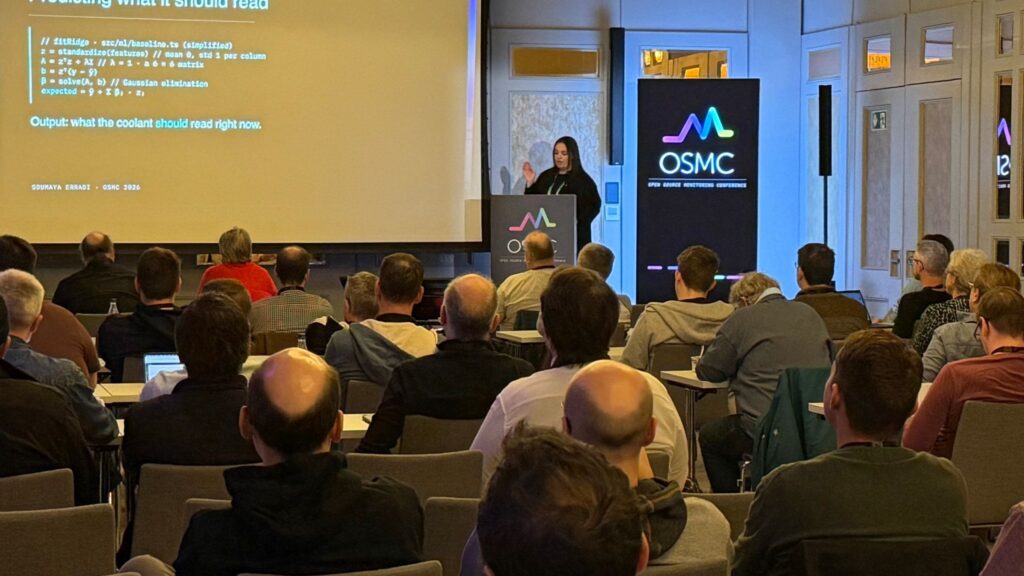
„Can an LLM understand your car? Real telemetry and predictive insights“ by Soumaya Erradi was an unusual use case but a very interesting start in the day. I really liked the realistic look at the challenge which came to the answer that machine learning can work with the data in a way that LLM can afterwards do what it can do best explain the findings. Also the math involved in giving the data context and allow prediction was way over my head but interesting to see. Much against my experience they had to work with a quite small number of training and testing data, but still got a model they could reliably work with even it was not perfect.
The LLM was not fed with the data directly but an interpretation to work with and was than carefully checked for hallucination. And there was a fallback to still provide never a blank screen even if LLM is not available or reliable. Her takeaways which could be applied also to other use cases where 1. Learn normal, then forecast, 2. measure your forecast and 3. ground the LLM, then verify.
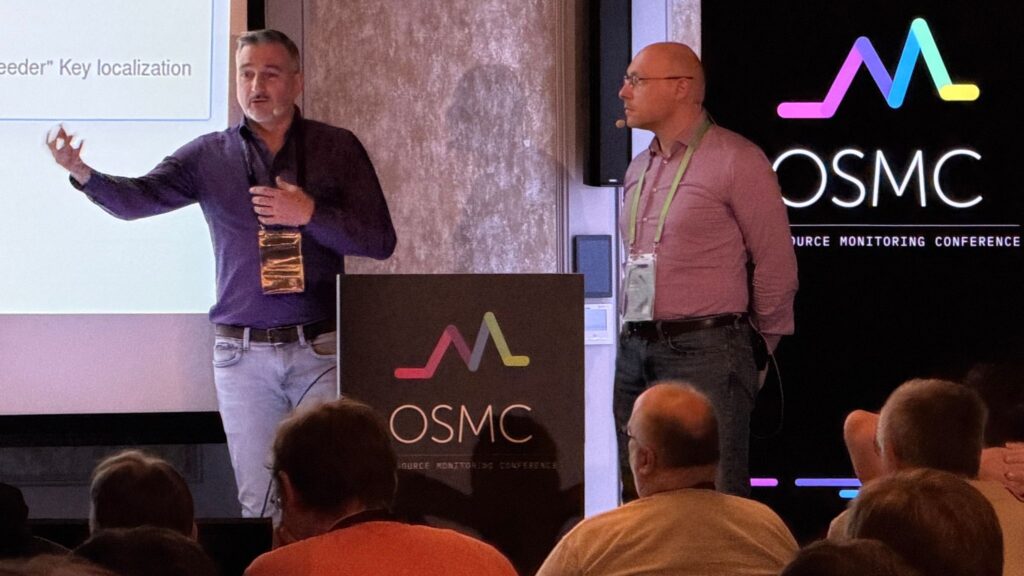
„IMEdge – Network monitoring on the Edge“ by Rocco Pezzani and my colleague Thomas Gelf started with a look back where everything started with a prototype shown by Tom for a SNMP MIB browser. This resulted now in IMEdge a very powerful SNMP based monitoring. As Tom explained while some call SNMP dead it is still everywhere especially when looking at the network and showed some numbers proving the modern alternatives are not really an alternative for the expected amount of data. But data is not everything you will also want to get nice graphs created based on it, IMEdge does so for you including percentiles and peaks for more context.
If you want to use it with your trusted Grafana there is integration provided for it so you can even get it combined with other data sources. Data management is also included to handled orphaned data like Permission management is there for handling access. Another feature is the MIB browser which seems very powerful to overcome the low quality of MIB files you can find out there. While it looks already quite powerful there is a packed roadmap for 2027 with further improvements. So if you want to look into it yourself you can install it already, but their plan is also to have it publicly available via a demo by beginning of December.
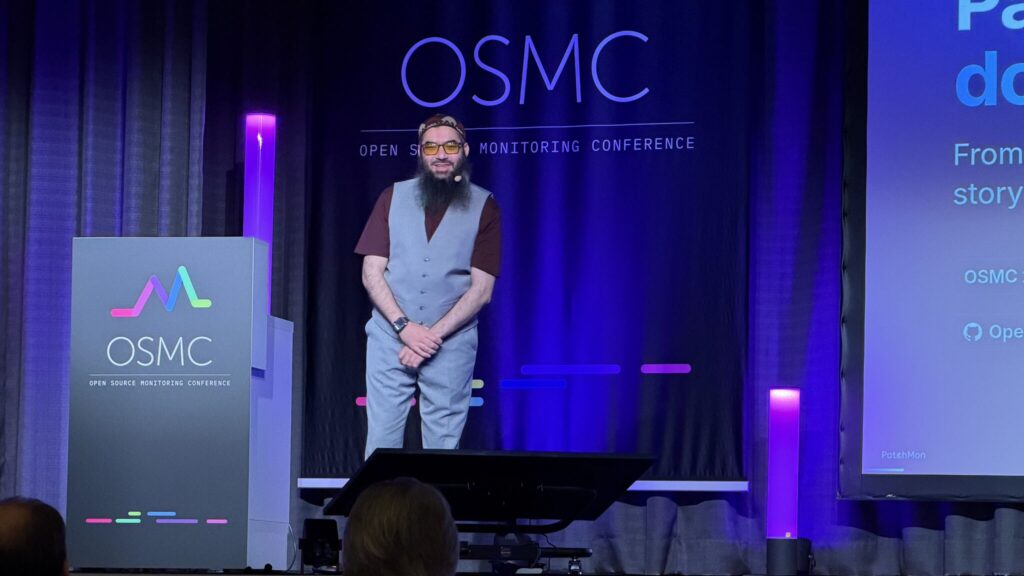
For „Patchmon – patch monitoring done right“ Muhammad Ibrahim and Mattias Schlenker teamed up like they did already before for the integration of Patchmon and Checkmk. Muhammad gave his very first talk and did really good, starting with explaining the problem he wanted to solve when developing Patchmon and how the importance has grown with the quickly increasing number of critical exploits. This was also shown by the welcoming community which built in a quite short time around the project. He also explained the project’s history from a technical perspective leading to a one line installation of the go components providing many integrations. The feature set looks nice and the roadmap wants to improve it further. So I recommend a look into if you need a better overview of your patching and not looking for a full software management solution.
After Muhammad Mattias took the stage to talk about the integration into Checkmk building the bridge between patch monitoring and infrastructure monitoring. The integration consists of a special agent getting the data into Checkmk and additional view including a link to Patchmon for the full details. But he also added a Zabbix integration providing similar features.
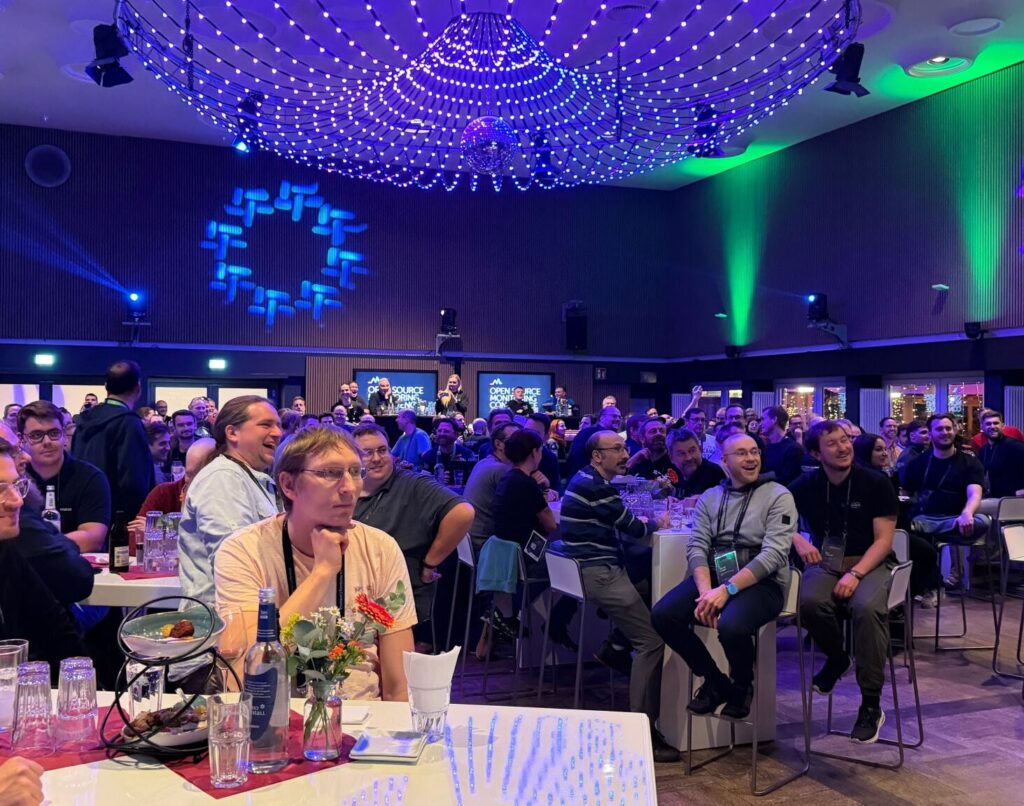
After these three talks it was time for the lunch break which worked great load-balancing all the attendees on three food stations with excellent food.
The Ignites
Ignites are a very special format. 5 Minutes, slides on autoplay is a real challenge for the speaker, but provides the option to include some smaller or very different topics and are a really good way to start in the afternoon.
First ignite was „Beyond Traditional Observability – How Grafana data sources extends the Modern Needs for your Infrastructure“ by Syed Usman Ahmad, a regular speaker I have met many times over the last years. But still he showed some data sources I had not seen until. As we have add n8n to our portfolio I am especially interested in trying this one.
In the second ignite Markus Opolka, another of my colleagues, showed „How we integrate Prometheus and Icinga“. Markus managed to give all the background and show all the integration like check_prometheus and Prometheus backend for Performance Data Graphs.
And last but not least in „Dragonfly Mail Agent – The Minimal Mail Transport Agent Monitoring Admins Love“ Matthias Schlenker entered the stage again. He looked at all the options for providing a MTA for your monitoring solution coming to the conclusion that Dragonfly Mail Agent is the only one he wants to use with all the shortcomings of the others.
The Afternoon
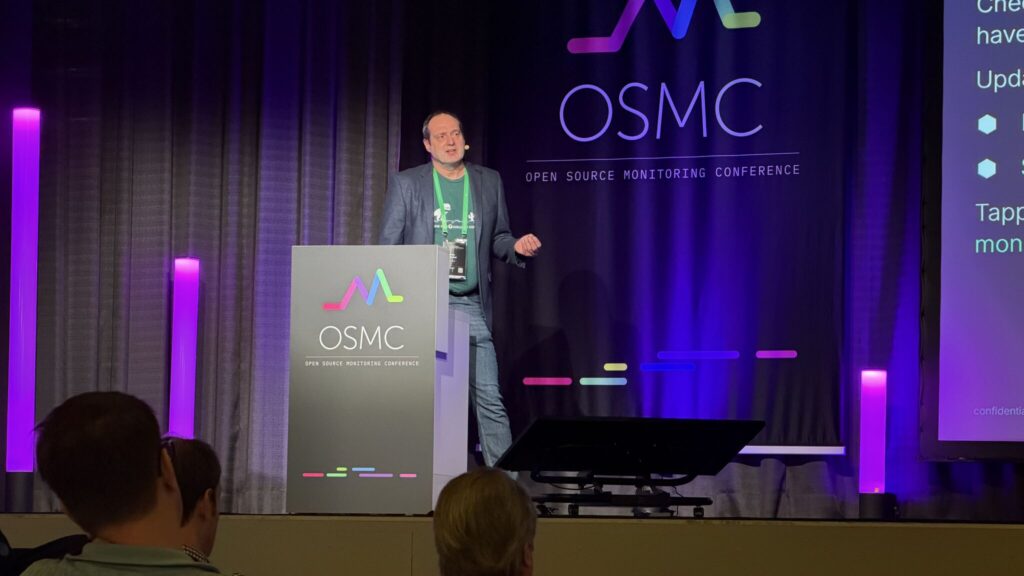
Afternoon talks started with „Runtime Lineage: End-to-End OpenTelemetry Tracing for AI Data Systems“ by Tom Kaltofen. His background is a bit different as he primarily works with the data fed to AI and monitoring only comes as a requirement for doing so. So he works with different signals as data lineage is no trace like he explained by comparing the terms used by OpenTelemetry and OpenLinage. But in the end he needs both created by one hook with the same idea for the full view. In reality it is not so easy as there is no tooling yet for it and he hopes to get this in the near future.
Dominik Schmidle convinced me with his talk yesterday to join him at „Capability-as-a-Service: Self-Hosted Observability That Feels Like SaaS“ today again. He asked the question how to get the advantages of SaaS for Observability without the price tag typically coming with it. So he wants someone running it with enterprise features and one API as the way in, but rebuild this as self-hosted. Building it with mutliple Open Source tools comes with the integration tax. So he went with Kubernetes operators as a base solution but this only solves the tools themselves not the clue between. For this he used two more Kubernetes paradigms named Control and Data plane. He talked about how far their solution is and what still hurts. But if still some things are not finished yet, they plan to add more capabilities to it.
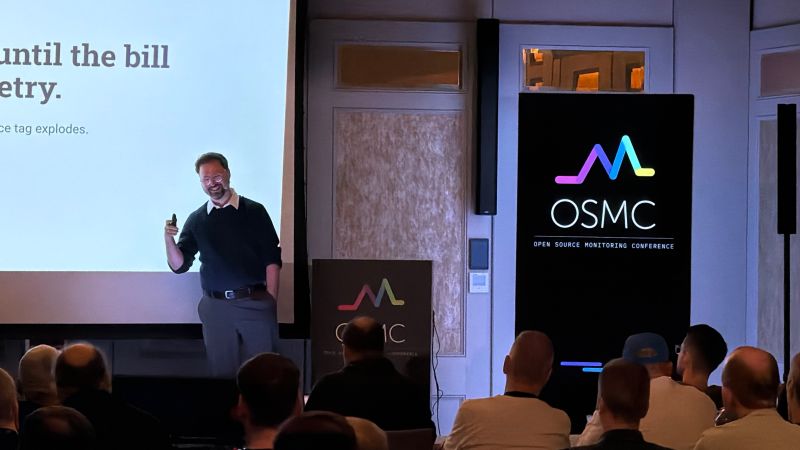
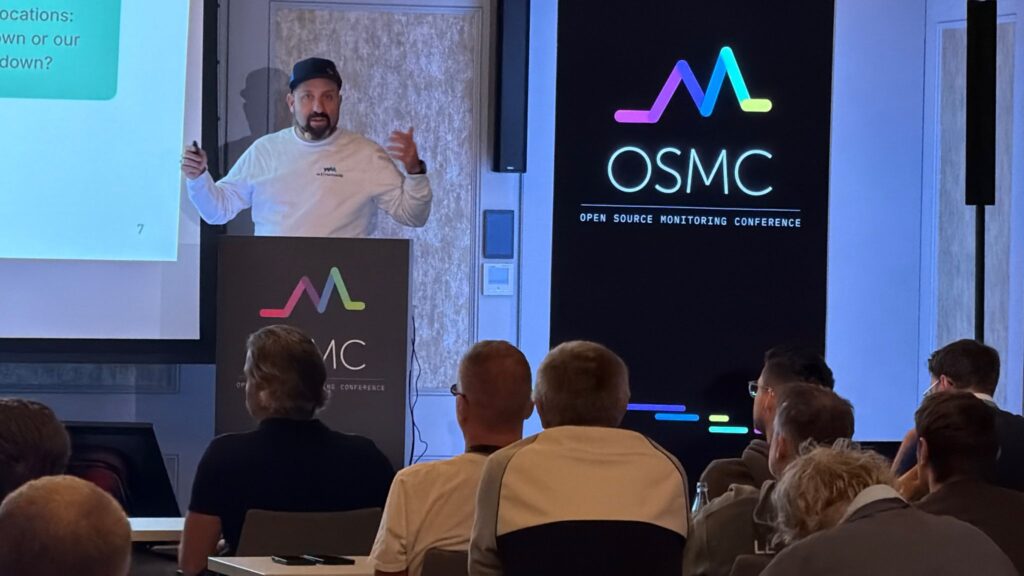
„Open Source End-to-End Monitoring“ by Andreas Lehr started with a definition of what end-to-end means and why those checks are needed which can be summarized you want to see how the application behaves for a user without a real user hitting a problem. He argued for running different checks which give a different level of details in different intervals as they come also with different costs. If you want this in Prometheus and by this in your Grafana dashboards he has Prometheus Synthetic Exporter for you. And you can take away from the talk multiple things like measure from outside, from more than one location. So this talk would be in the list of those I would recommend to watch when it shows up in the conference archive or later on youtube.
Last but definitely not least „Red Hat’s journey of moving Observability for 1000s of clusters to a third party vendor and then back in-house“ by Daniel Mohr was one talk I was really excited for. With his team he is responsible for three different observability platforms with RHOBS being one of it. This internal multi-tenant service was the main character in his story starting with another team responsible for service delivery deciding for an external vendor. After some organizational changes the strategy changed even after the vendor solution was a big to bring it back inside.
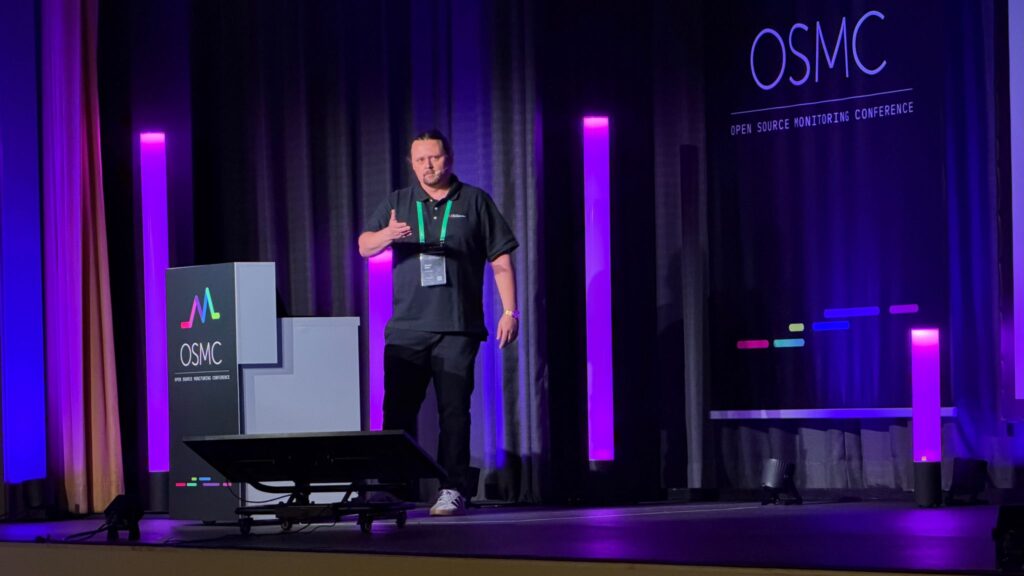
Not only to cut down on costs but also to improve products with the experience from hosting. The self-hosted solution utilizes Thanos, Loki and Alertmanager to built their Prometheus stack. Building it they for example learnt to not relay on external services, scale can break cost estimations and mixing site reliable engineers and software engineers in a team improves the solution. What they built handles a huge number of data with a very high availability with 37% per TiB and 5% per billion samples of the costs of the vendor solution at optimum utilization, or 71% per TiB and 23% per billion samples in real. And while cost is important, but more important is control and how it helps to improve the products for the Red Hat customers and community like Perses. So if you ever have to argue for „eat your own dog food“ and self-hosting, grab this talk as an example.
Save Travels
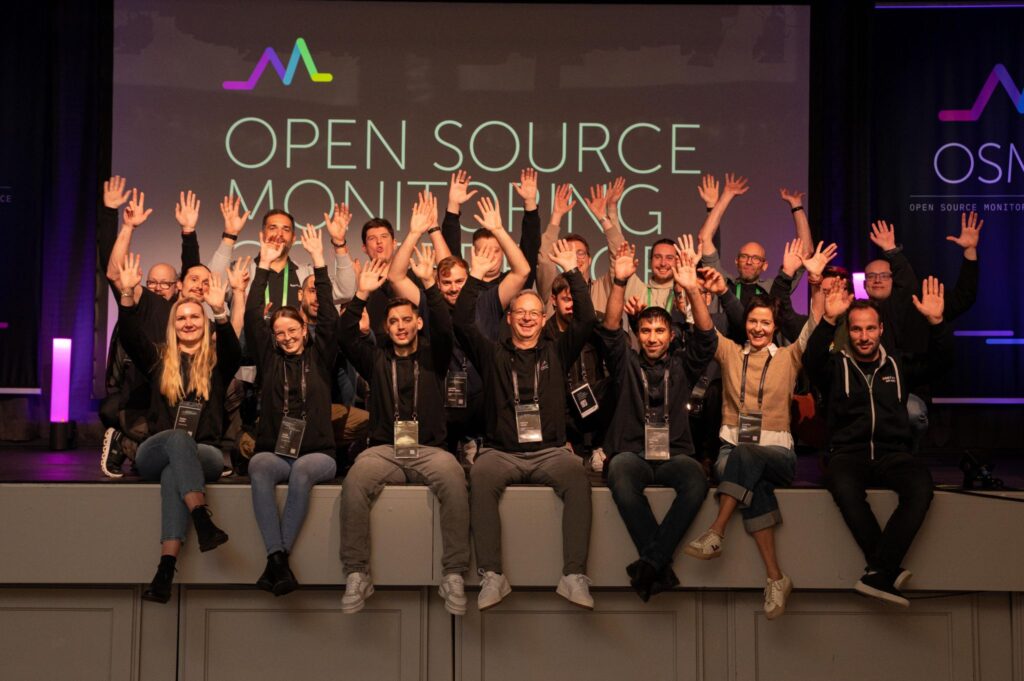
I want to say thank you to all those who made OSMC a great event and as it was 20th anniversary not only for doing so this year. So thanks to all the speakers and sponsors, all my colleagues involved and of course to all the attendees! Save travels and see you next year! Date for next year still needs to be finalized, but OSMC 2027 is very likely to happen in November again.
Also thanks to all who just did read my recap, I hope you found something interesting and perhaps you will join next time!

0 Kommentare