

Although I have been an Icinga developer for over two years now, this was my very first OSMC. I went to meet some of our community members and see what others are doing in the monitoring domain. Getting new impressions always motivates me and helps me avoid getting stuck in groupthink.
Thus, I tried to visit a variety of talks, both in my field and on topics with which I am not familiar. However, I usually try to avoid the latest hype.
Without further ado, let’s get started!
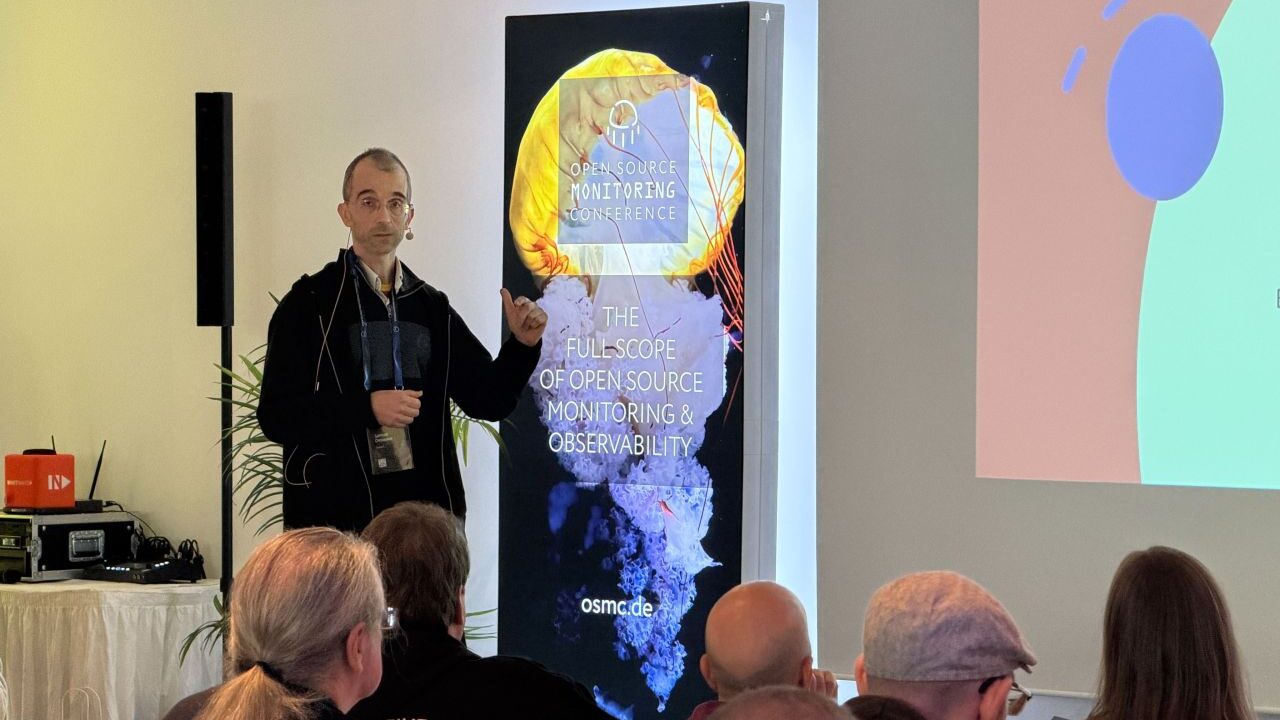
The Morning
Monitoring a small world
After the opening remarks by Bernd Erk, I headed to Mattias Schlenker’s talk, „Monitoring a Small World“. His presentation revealed his passion for tinkering with hardware and technology. He showcased off-the-shelf and homemade microcontroller hardware that can be embedded in a Checkmk monitoring setup.
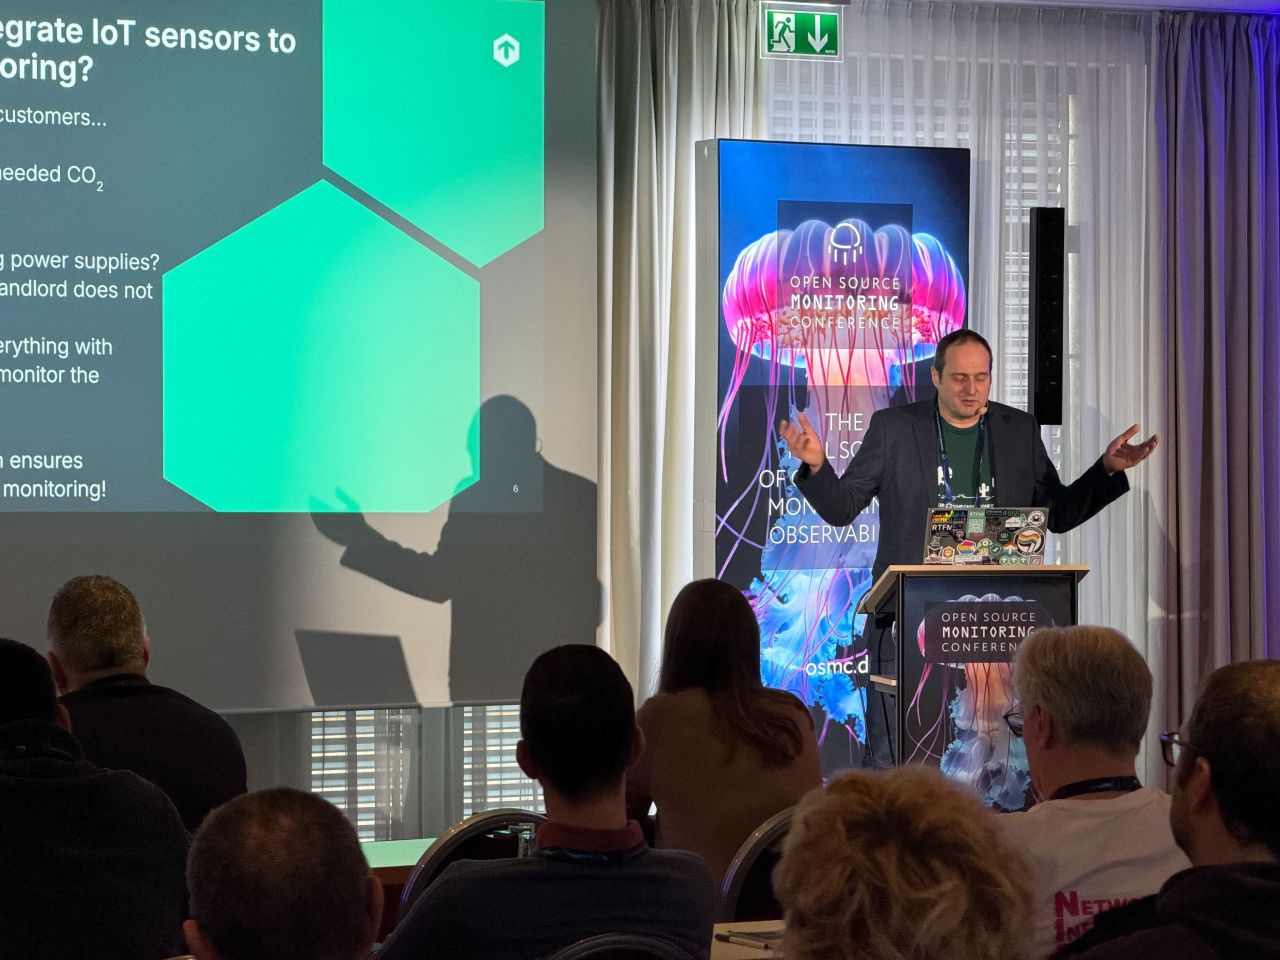
Inspired by a CO2 traffic light used at their own conference, he discussed the challenges of integrating these metrics and their monitoring thresholds into their system. He also brought forward other examples, such as temperature sensors and door state checks.
Multiple examples were shown of how to make monitoring checks and performance metrics available for a self-programmed microcontroller in MicroPython. These examples ranged from a simple TCP listener for a Checkmk agent to an MQTT-to-Fluentd-to-OTel pipeline to Prometheus metrics and pushed syslog messages. In addition to presenting these possibilities and explaining how to address such issues, he transitioned from the IP world to LoRa and LoRaWAN.
Referring to the previously mentioned conference, he discussed the issues of reliability caused by many small devices using Wi-Fi over the heavily used 2.4 GHz band. Therefore, they switched to LoRa to send metrics from different kinds of sensors that would be collected and processed in their monitoring setup.
As someone who loves tinkering with small hardware, I could relate to his passion and was reminded of the microcontroller boards in a box at home waiting to be integrated into my own monitoring system.
Auto Discovery with Icinga
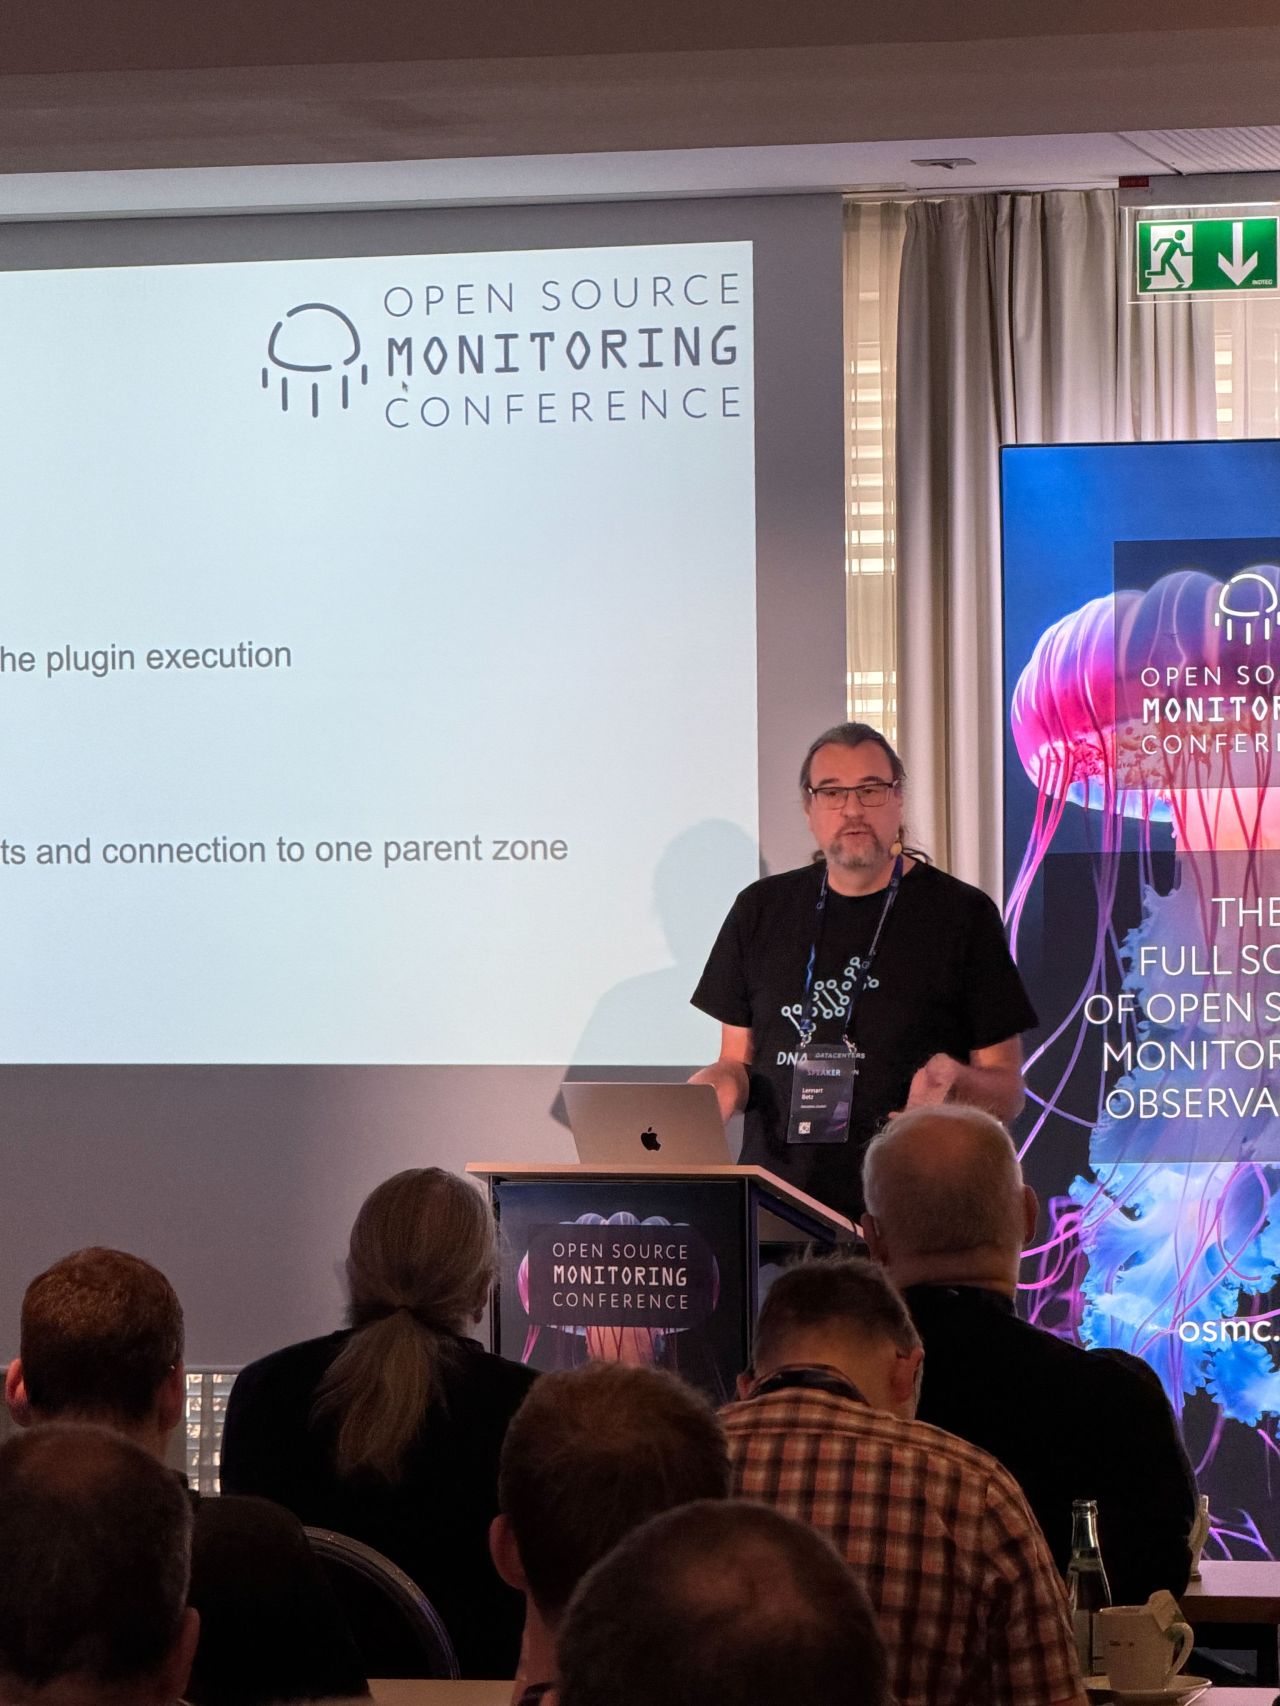
I stayed in the same room and awaited Lennart Betz‘s presentation, „Auto Discovery with Icinga“. It was a demo-heavy talk that presented how to use Puppet, or OpenVox, to create an Icinga 2 configuration.
In Puppet, Facter can query a variety of facts from each machine. These facts range from the installed operating system to available mount points, for example. Puppet then collects this information and writes it into the Icinga 2 configuration.
In addition to the obvious benefit of having an Icinga 2 configuration without doing it by hand, this also brings updates from the machines directly to the monitoring system. For example, a new mount point results in a new disk service check.
In theory, this works well, but the demo gods are vengeful, and some things did not work as expected. Nevertheless, Lennart managed to remain calm and deliver his demo in a roundabout fashion.
Enhancing Visualization in IcingaWeb2: From Markdown to Metrics
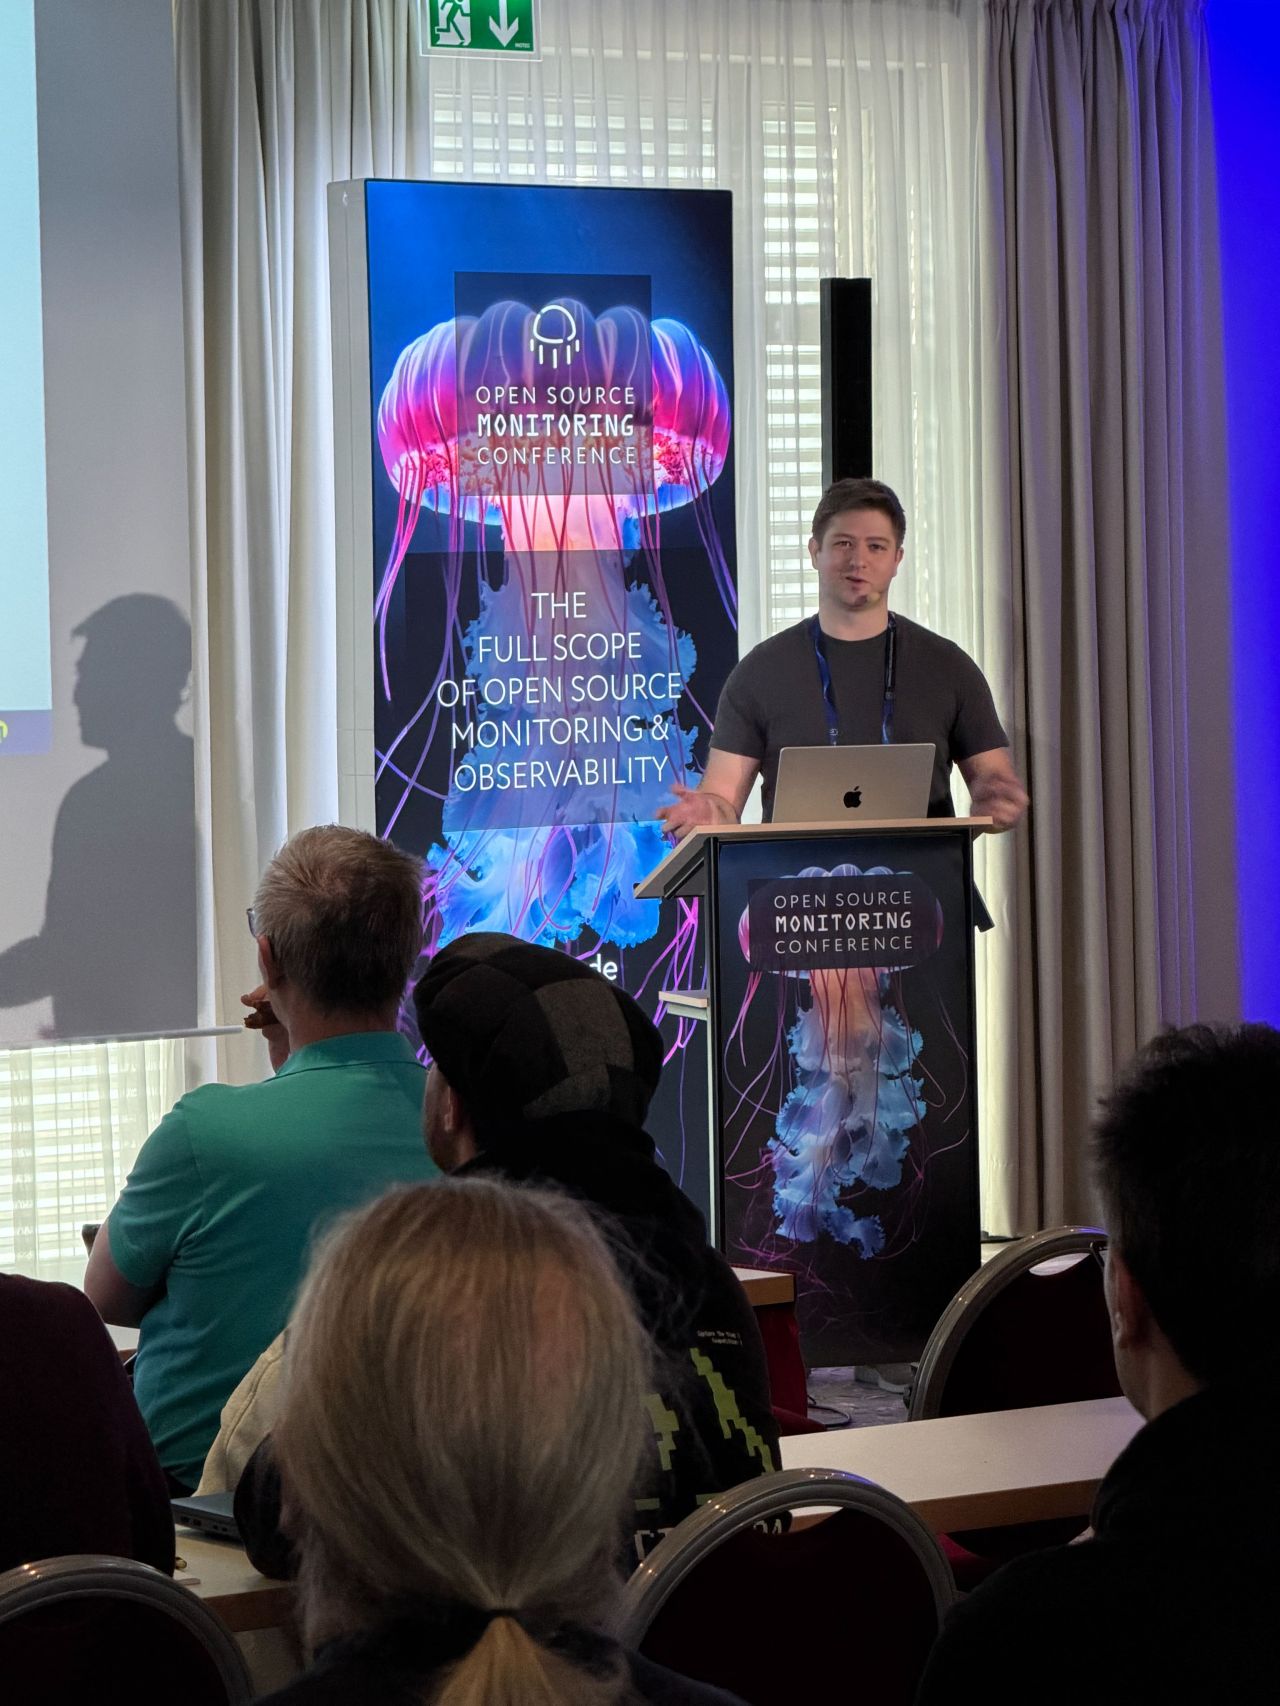
The next talk, „Enhancing Visualization in IcingaWeb2: From Markdown to Metrics“ by Nicolas Schneider, was also demo-heavy. I had only known him by his nickname from the Icinga Community forum prior to this, so seeing him in person was a change.
He forked and advanced some Icinga Web 2 modules at work and wrote many of his own. After a brief introduction to Icinga Web 2’s hooks for extensibility, he showcased his modules.
The icingaweb2-module-customdocs module, in particular, was a nice addition to Icinga Web 2 because it allows users to include Markdown documentation in dashboards. This will definitely be helpful when sharing dashboards across teams. Another well-received example was the icingaweb2-module-vislab, a custom graphing module that supports multiple backends.
This talk motivated me to explore the web side of Icinga and create my own modules. It also provided motivation for the following lunch break.
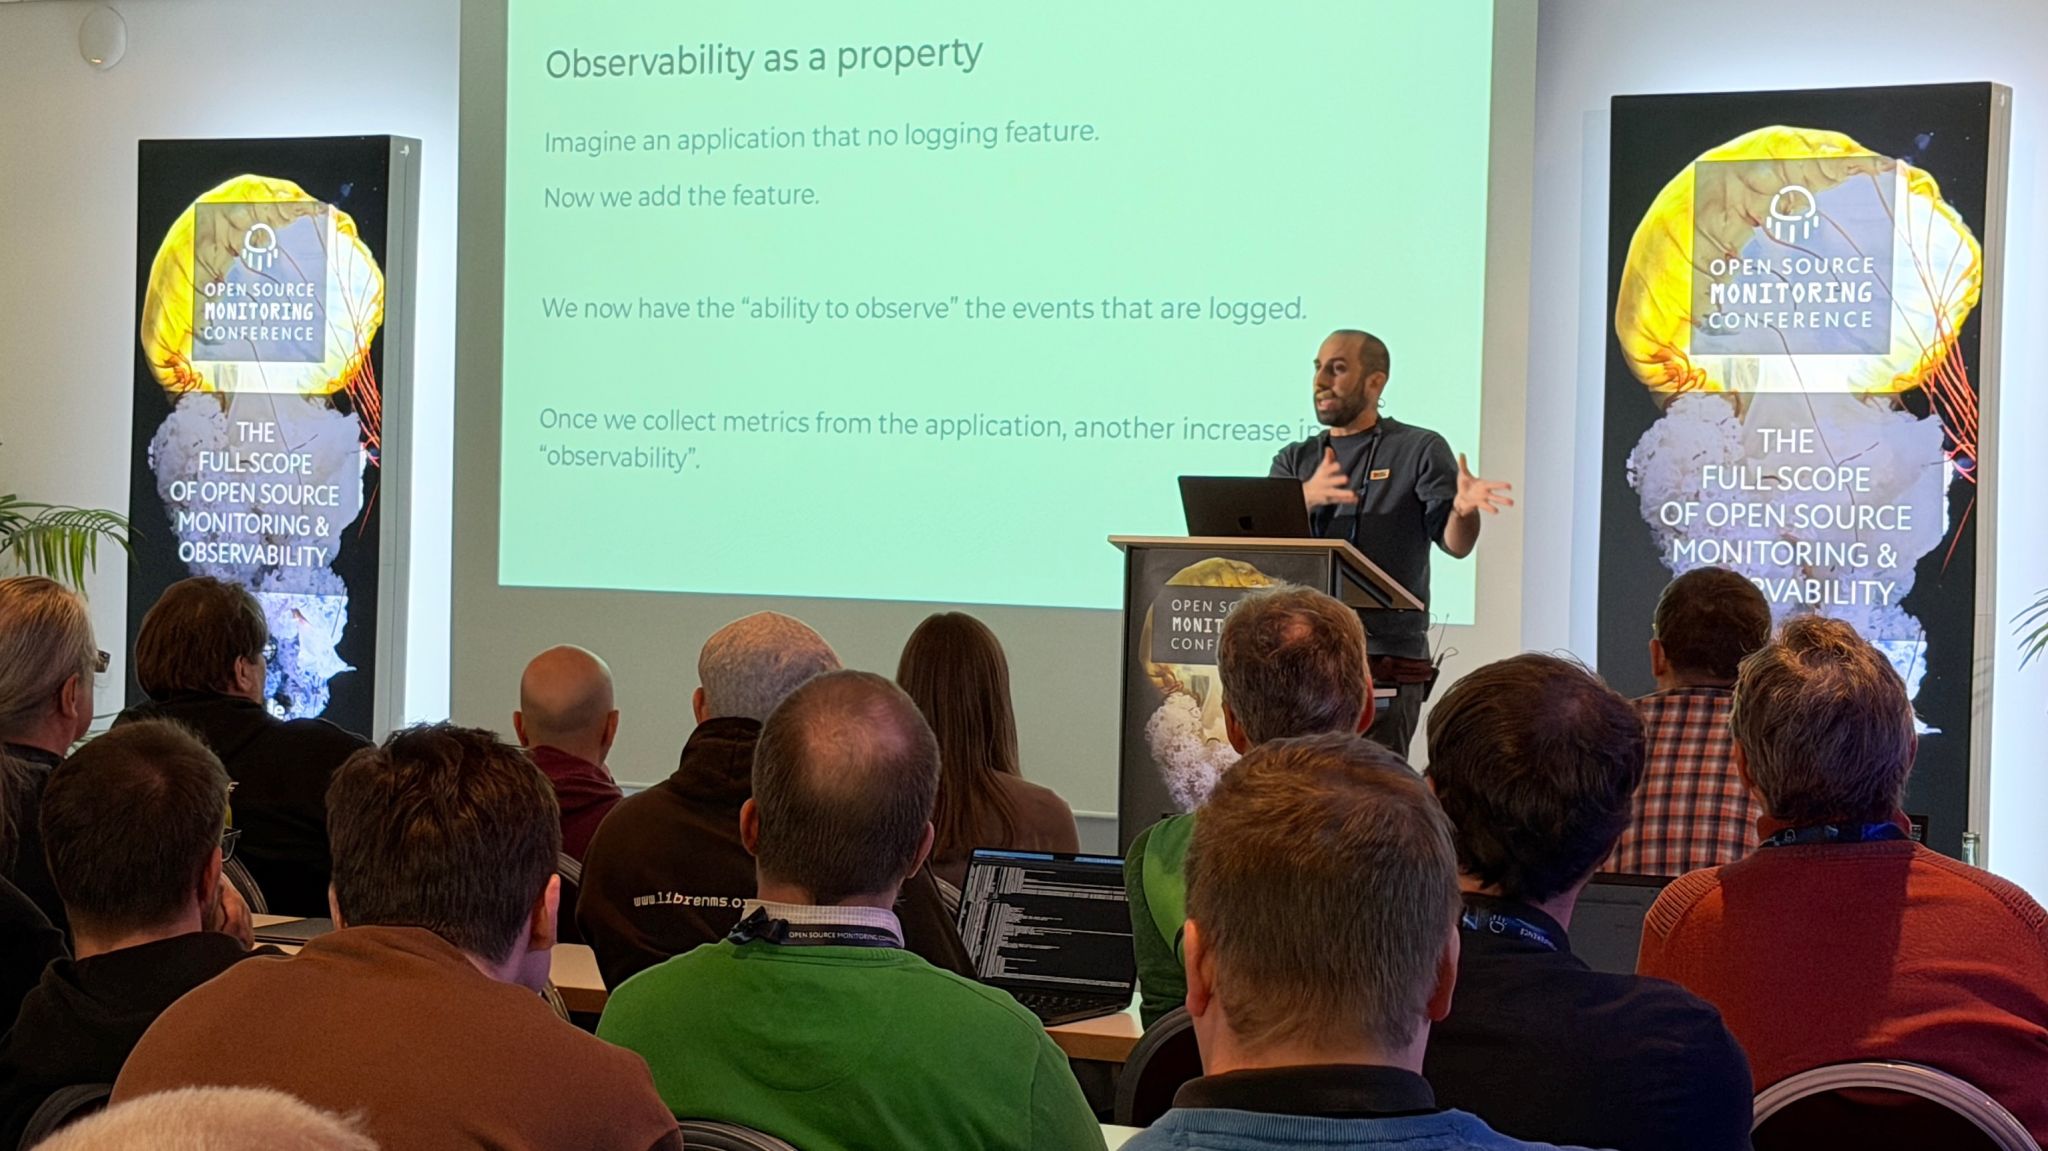
The Afternoon
Ignite Talks
With a full stomach, I headed to the Ignite talks. Each one was special in its own way, but I want to highlight Markus Opolka’s talk, „Observability vs Monitoring – A Linguistic Analysis“.
In this talk, Markus took an academic standpoint and explored the meaning of the word „observability“. After providing some linguistic background and making comparisons, he attempted to place a well-used word into context. Ultimately, words are used in a social context, and this context shifts over time.
Making the Kernel Speak Kubernetes: Unlocking eBPF’s Power for Observability
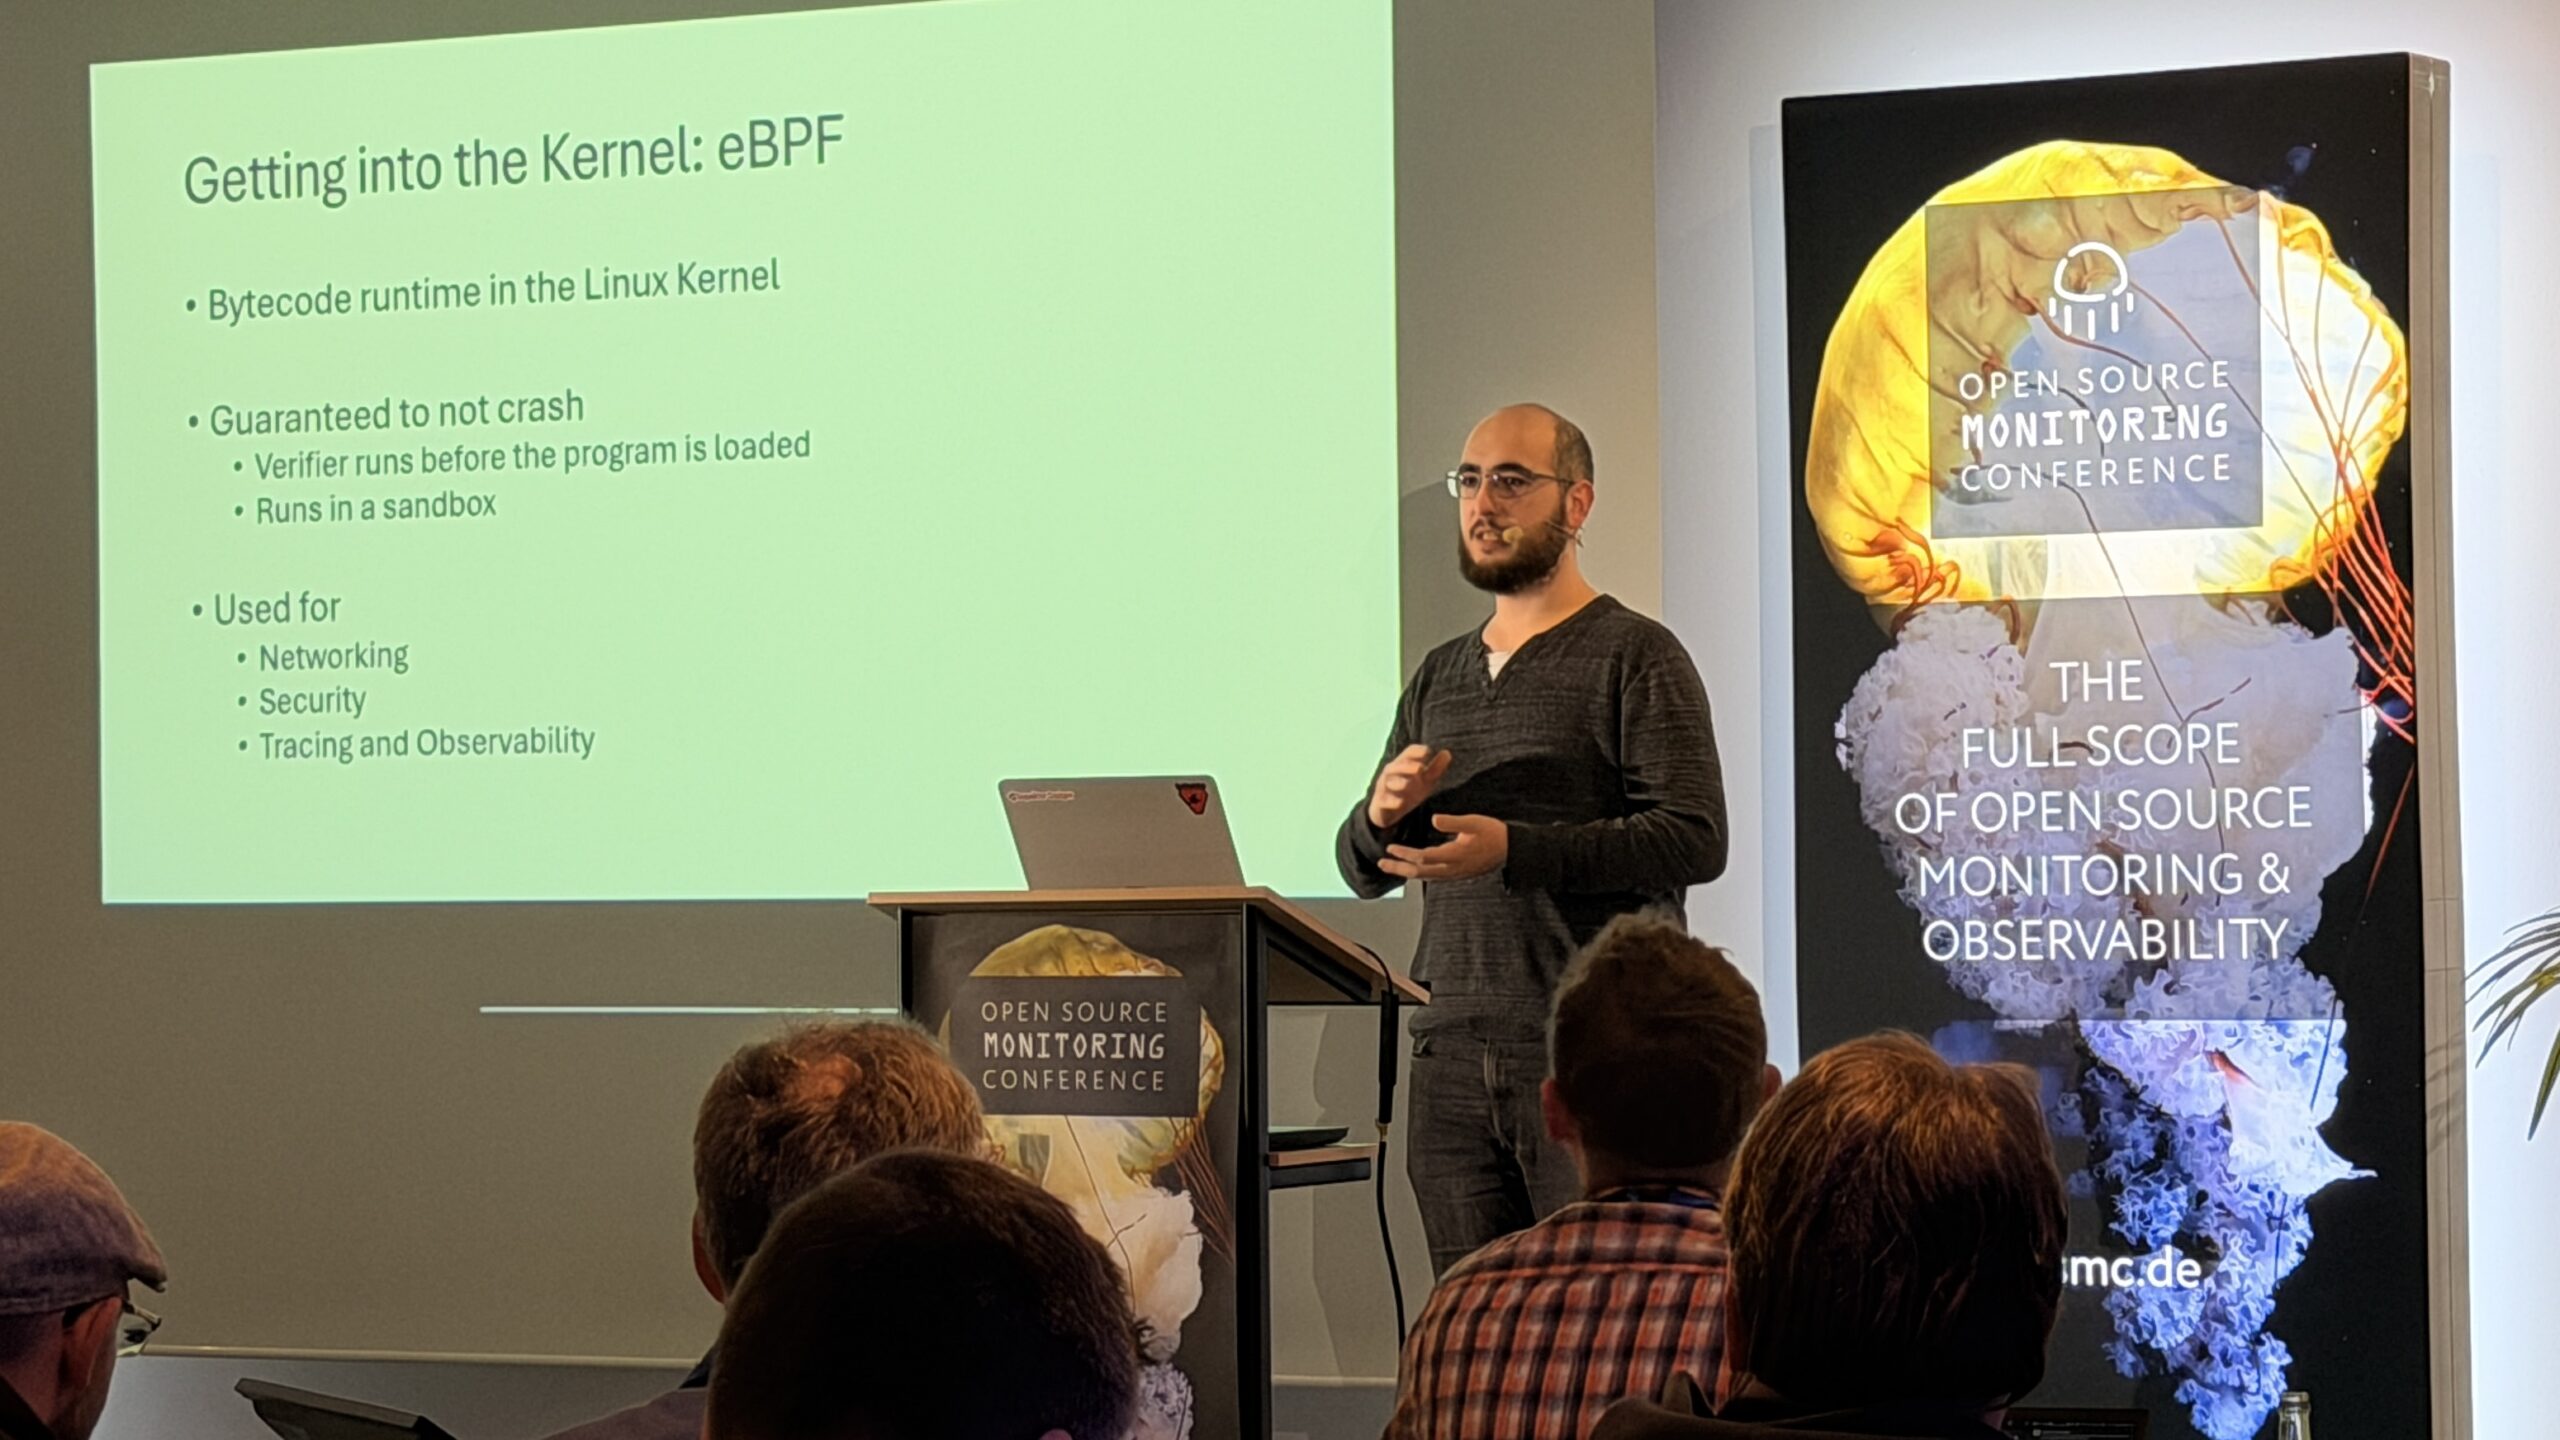
After some socializing, I headed to Burak Ok’s talk, „Making the Kernel Speak Kubernetes: Unlocking eBPF’s Power for Observability“.
Of all the introductions to eBPF I’ve had over the years, this was definitely one of the more beginner-friendly ones.
After briefly explaining the concept of eBPF – running sandboxed code in kernel space while performing business logic in user space – Burak introduced us to Inspektor Gadget.
Inspektor Gadget runs within a Kubernetes cluster and provides a variety of system insights powered by eBPF. For example, it traps system calls, resulting in alerts or filtering for further data processing.
This feature proves useful in a Kubernetes setup for normal background monitoring and debugging outages.
Measure what you manage: Sustainability monitoring in digitally sovereign clouds
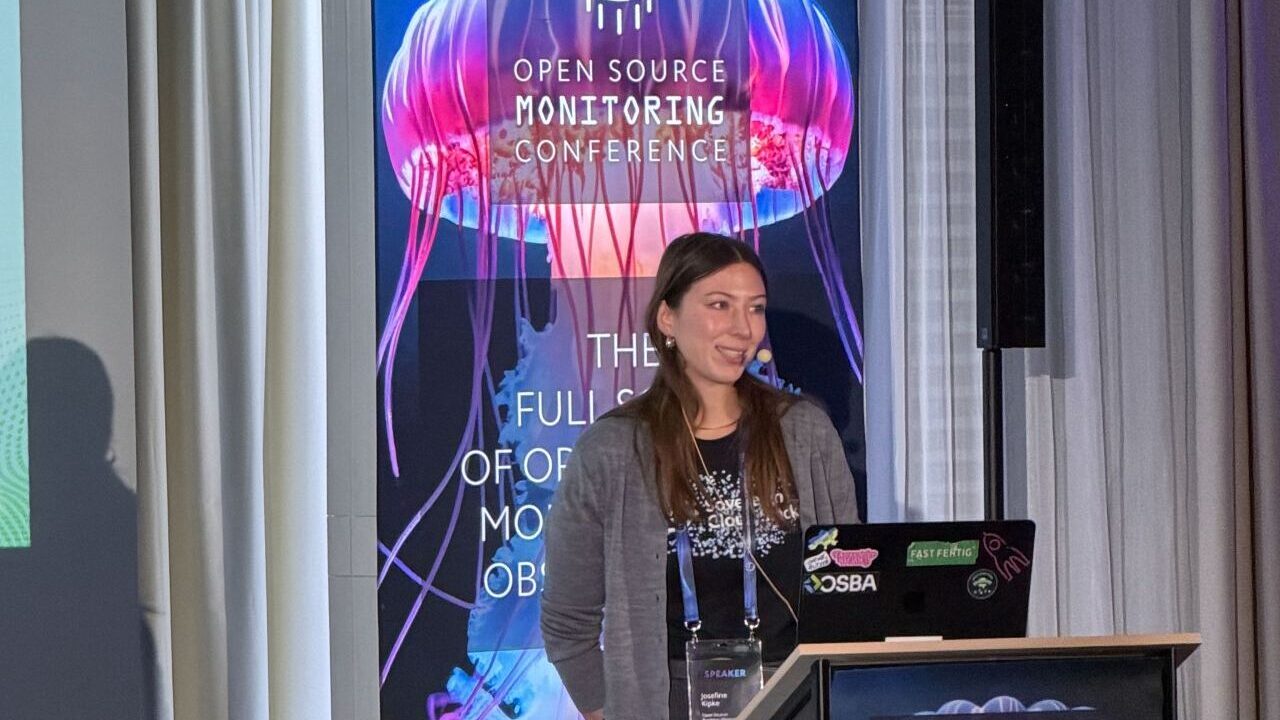
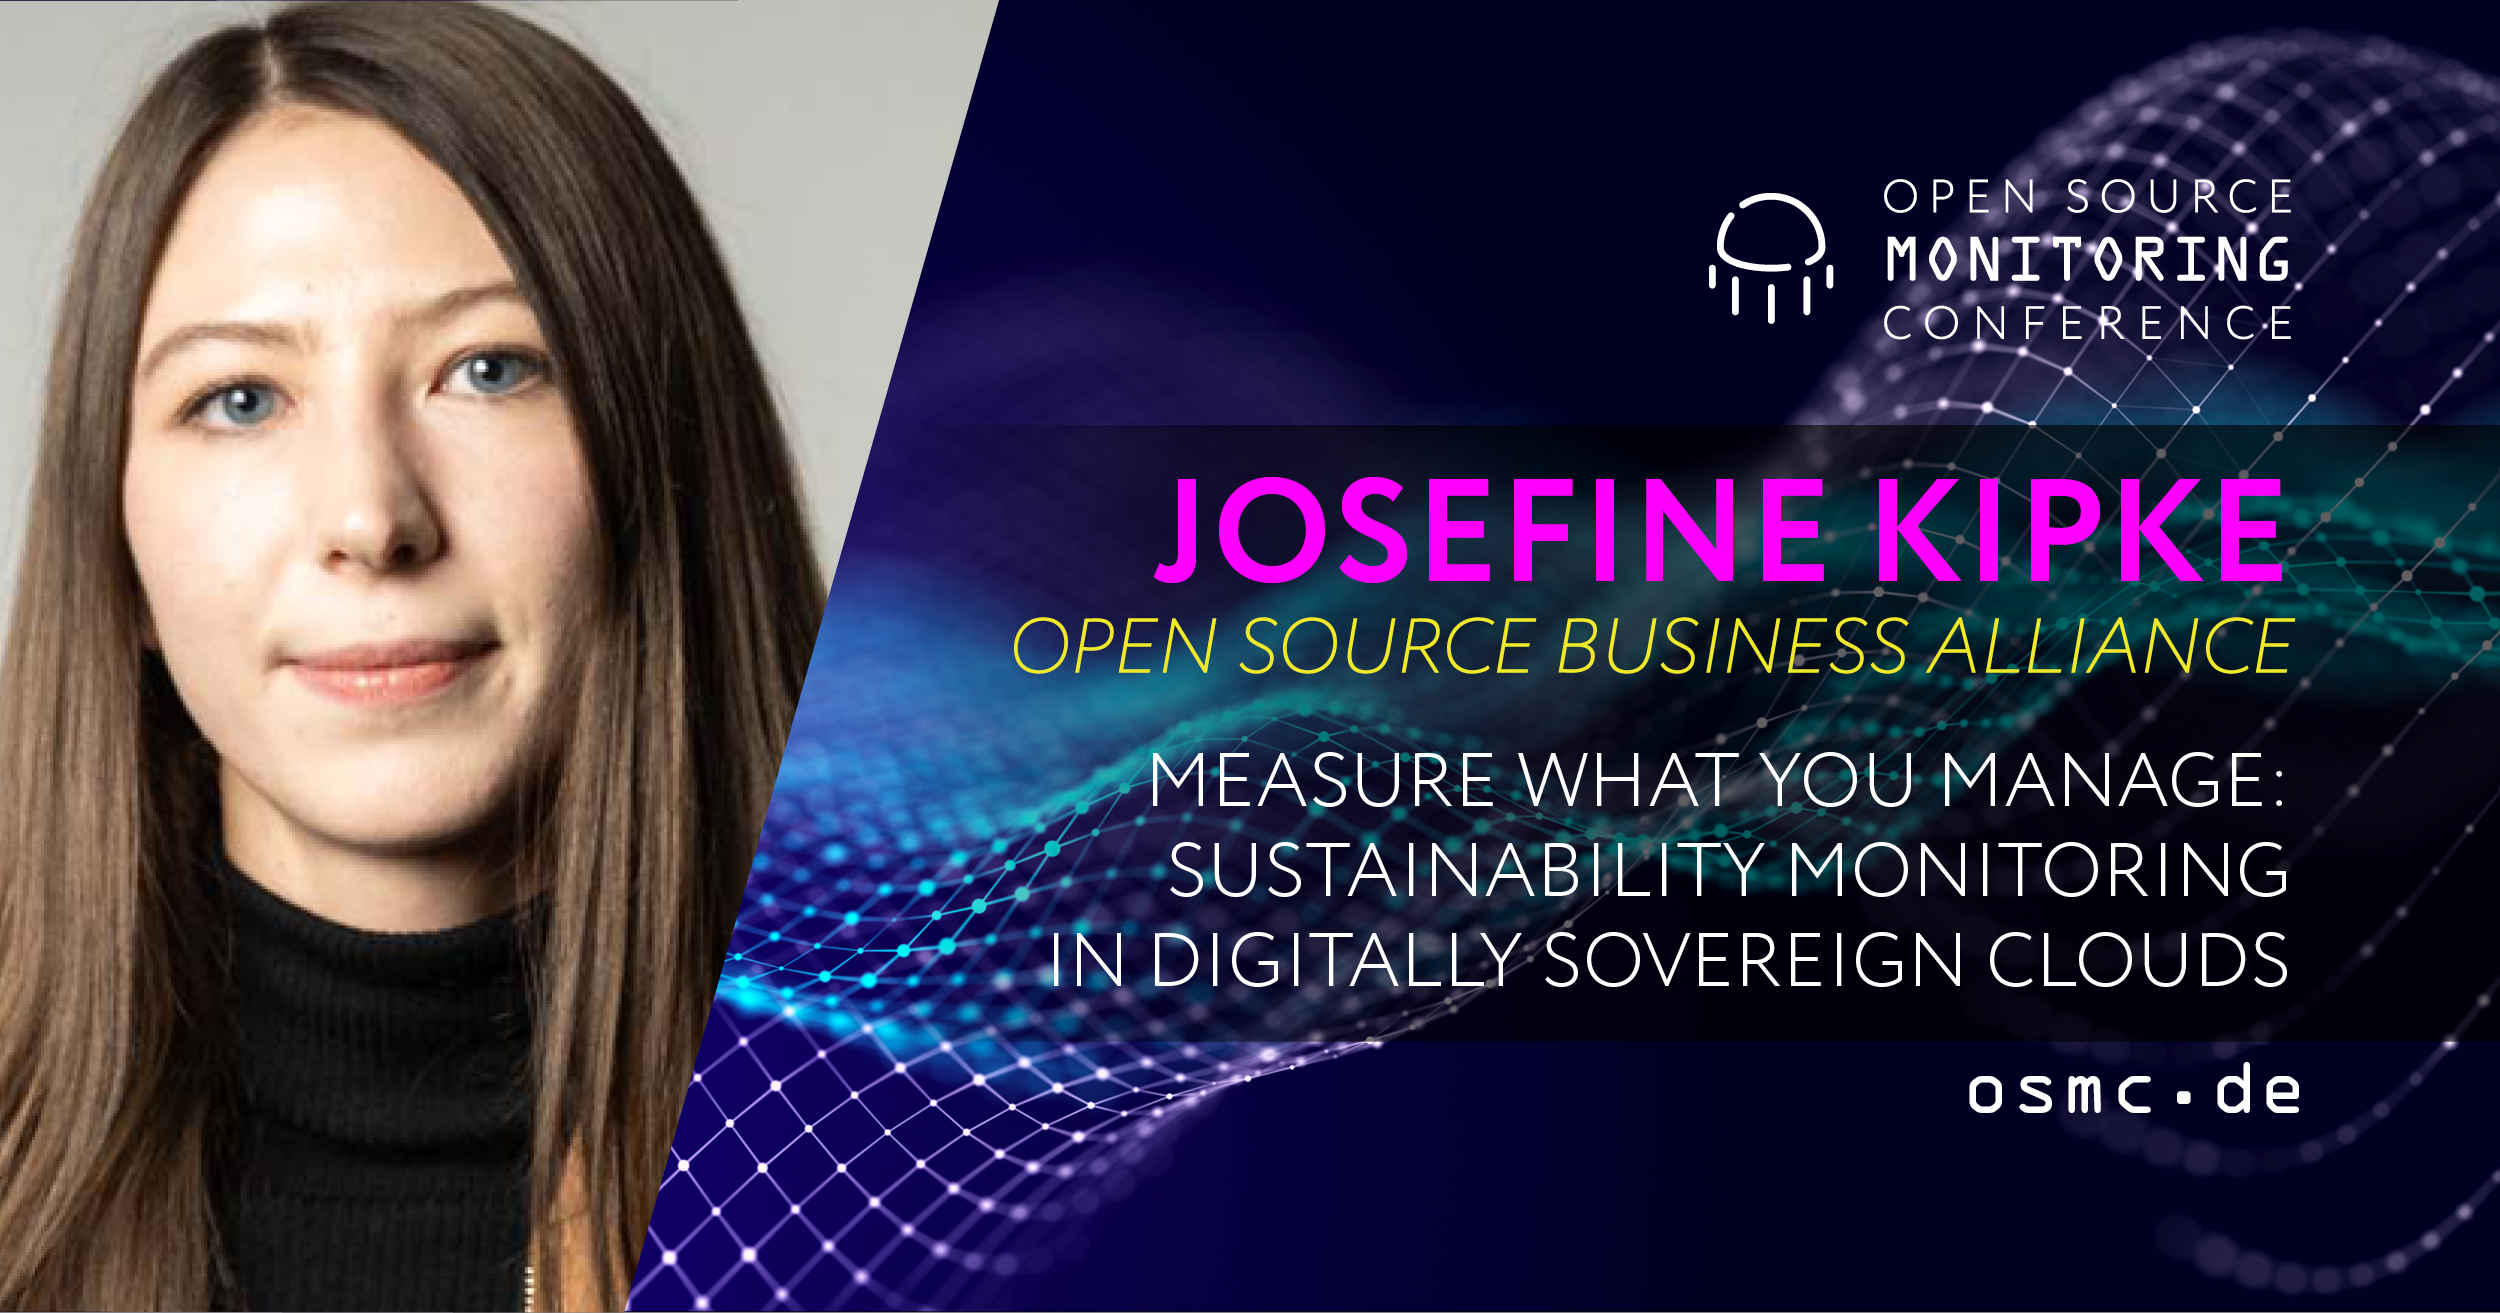
I switched rooms once again and headed over to Josefine Kipke’s talk, „Measure what you manage: Sustainability monitoring in digitally sovereign clouds“.
She began her presentation by discussing software sovereignty in the open-source world, focusing on standards and best practices for sovereign cloud stacks. Then, she introduced the ECO:DIGIT research project, which measures the environmental impact of software and cloud systems. Their system fetches energy information from system APIs and creates monitoring metrics.
Current State of Icinga
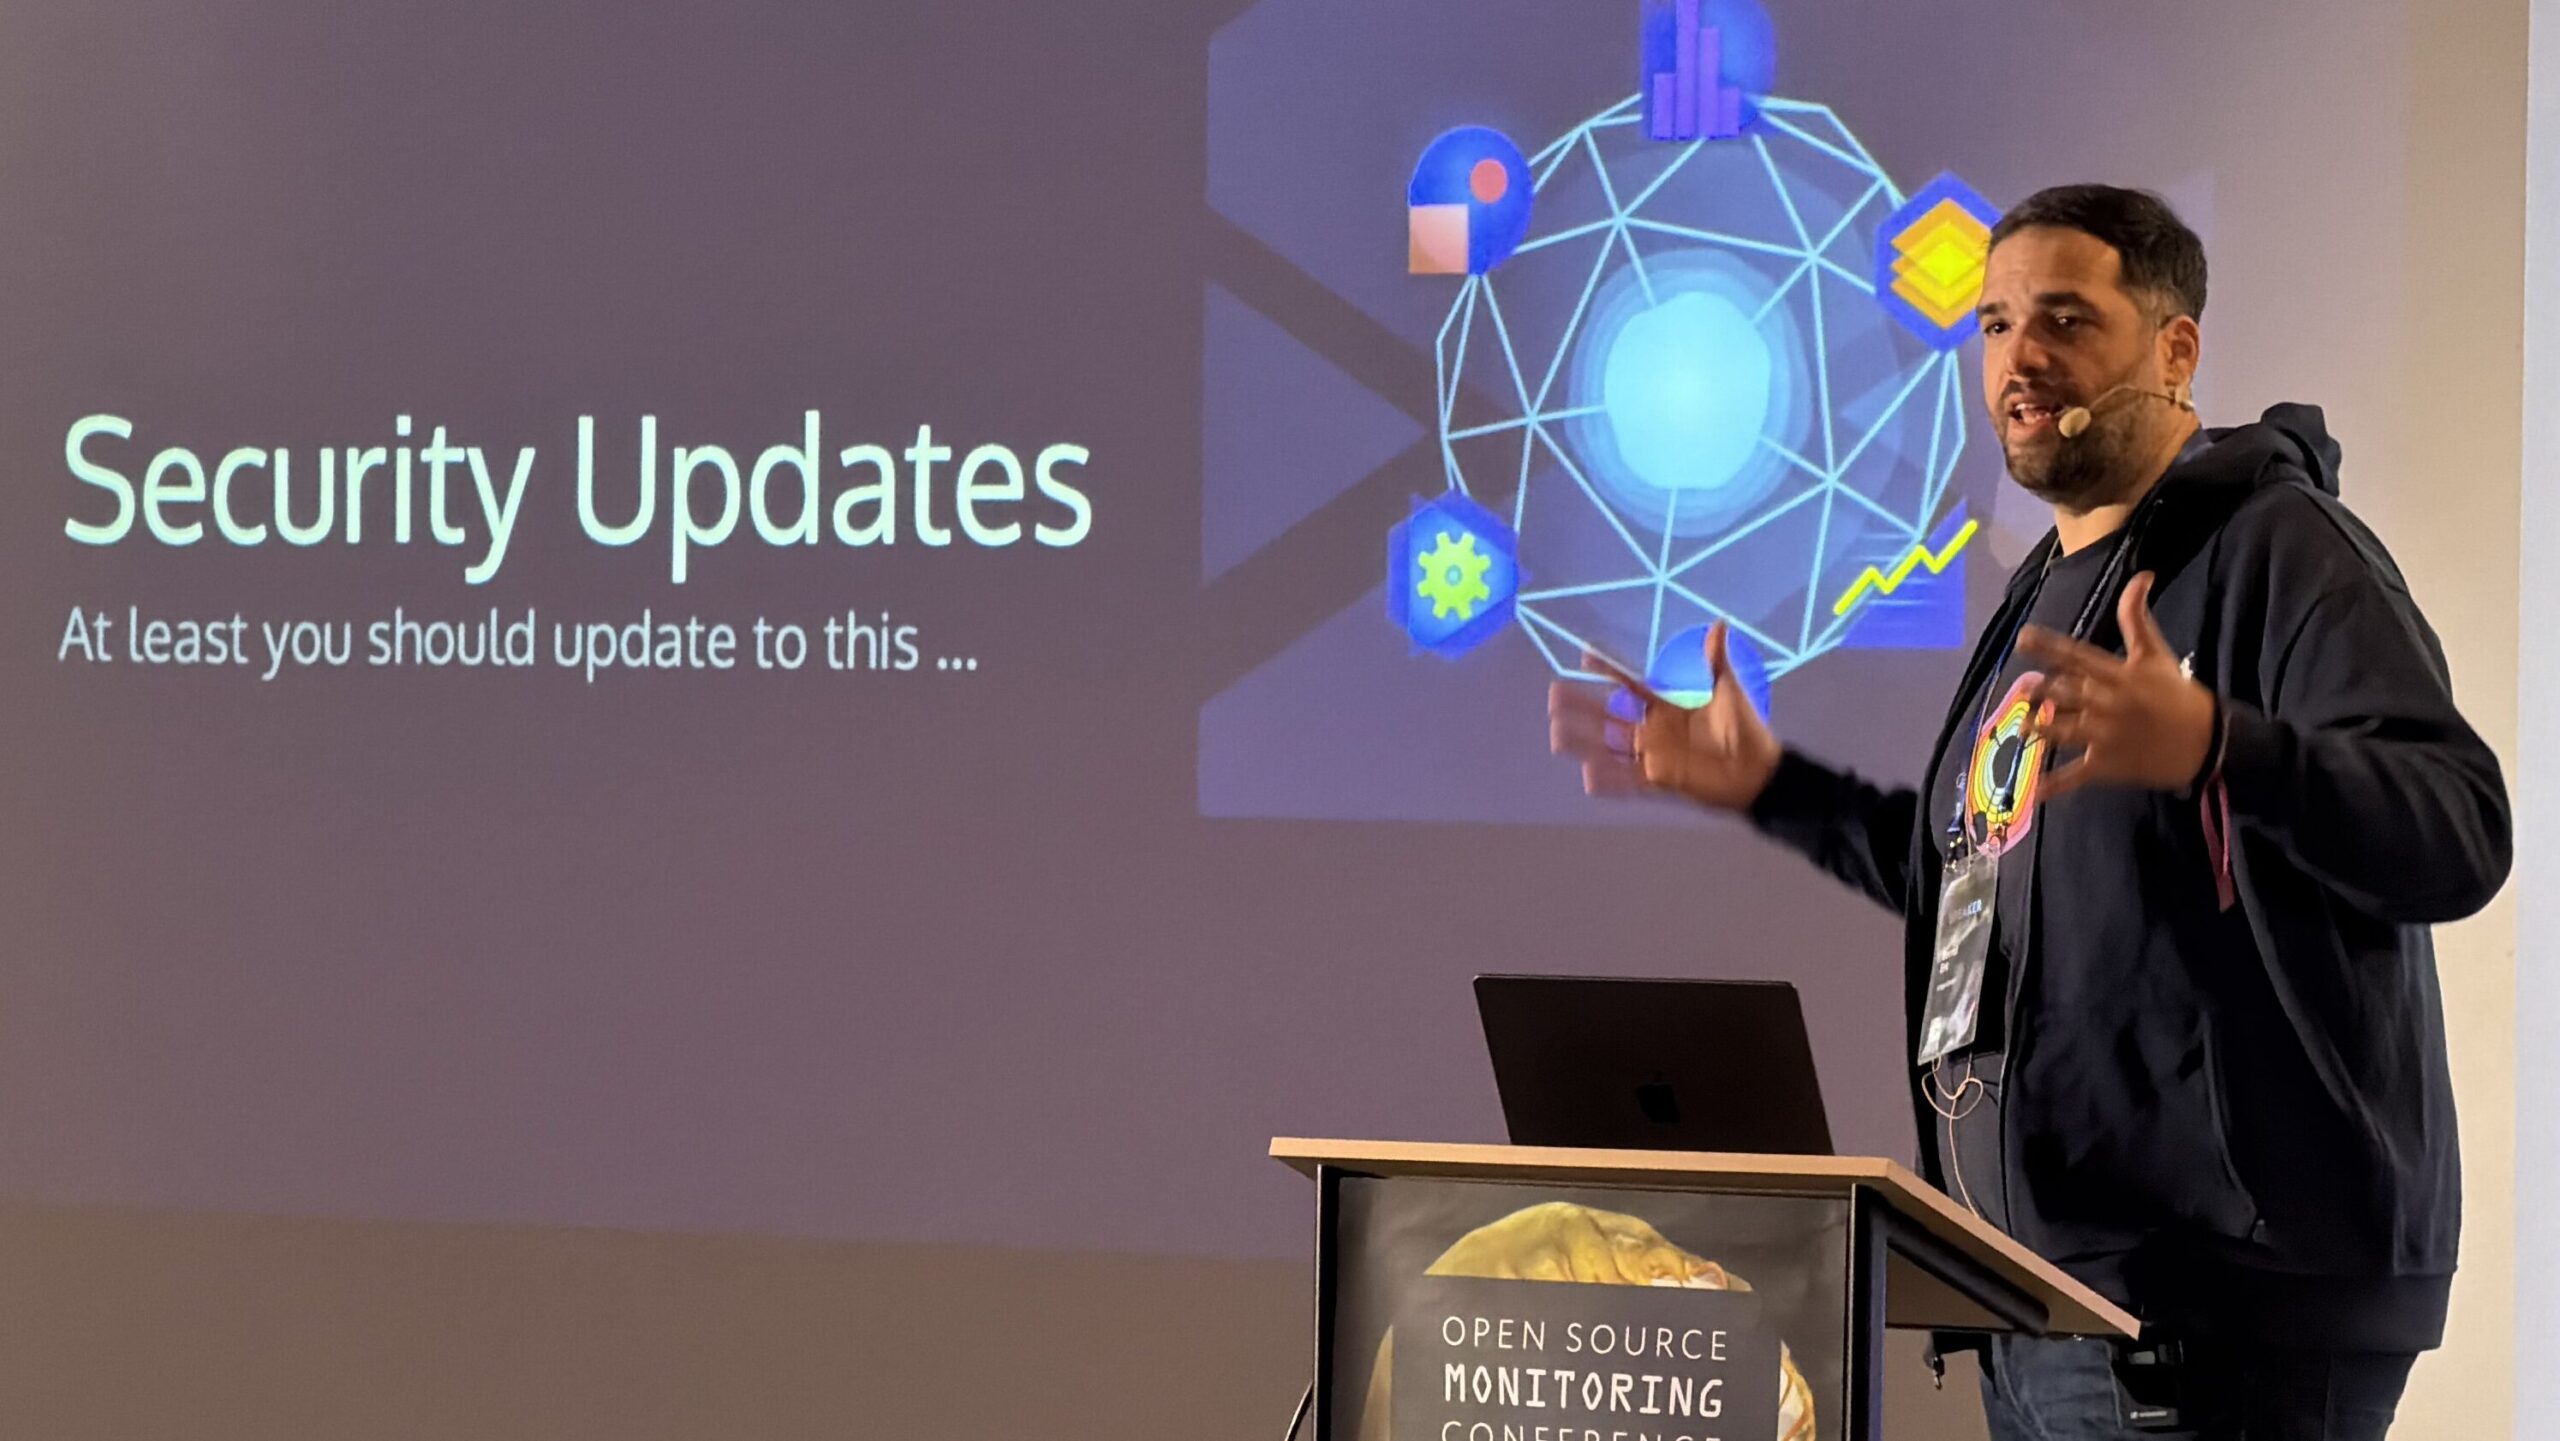
As the day started, Bernd Erk closed the talks with the „Current State of Icinga“. I had certain expectations for this presentation. As an Icinga developer, I expected to see the results of our efforts from last month.
A significant highlight was the release of Icinga Notifications and Icinga Notifications Web v0.2.0, along with the related components: Icinga Web 2, Icinga DB, Icinga DB Web, and Icinga Kubernetes Web. This change switched the main source of Icinga 2 events for Icinga Notifications from Icinga 2 to Icinga DB.
This information can be used to filter and create custom rules based on custom variables, for example. With many changes to the web interface, dynamic configuration is now easier.
The Evening Event
After Bernd’s talk, the crowd will now head to the evening event at KORN’S. Follow us on LinkedIn and Bluesky for some awesome impressions of the evening event. Stay tuned!


0 Kommentare